Download
1 / 37
370 likes | 380 Vues
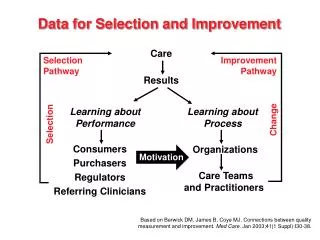
State and Local Data Use for Policy, Practice, and Program Improvement. Carolyn Bostick, South Carolina Department of Education, Office of Special Education Services Roy Fowler, Maine, Child Development Services Heather Reynolds, Westat, IDEA Data Center.

E N D
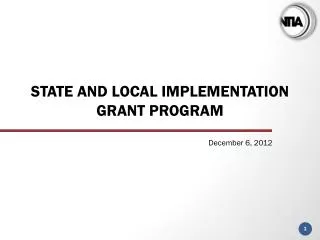
State and Local Data Use for Policy, Practice, and ProgramImprovement Carolyn Bostick, South Carolina Department of Education, Office of Special EducationServices Roy Fowler, Maine, Child Development Services Heather Reynolds, Westat, IDEA DataCenter 2019 OSEP LEADERSHIPCONFERENCE
2019 OSEPLeadership Conference Slide 2 DISCLAIMER: The contents of this presentation were developed by the presenters for the 2019 OSEP Leadership Conference. However, these contents do not necessarily represent the policy of the Department of Education, and you should not assume endorsement by the FederalGovernment. (Authority: 20 U.S.C. 1221e-3 and3474) 2
Objectives • Learn how states and local districts and programs are using data to respond to challenges and improve outcomes for children and youth with disabilities and theirfamilies • Identify areas of your own work that would benefit from strategic data analysis anduse • Gain insight into planning for data use, including how to engage stakeholders in making meaning fromdata 2019 OSEP LEADERSHIPCONFERENCE 3
South Carolina’s Part B DataStory Using Multiple Data Sources to MakeDecisions CarolynBostick 2019 OSEP LEADERSHIPCONFERENCE 4
Agenda • Types of datasources • How South Carolina uses thedata • Pros and cons of using multiple datasources • Conclusion 2019 OSEP LEADERSHIPCONFERENCE
Types of DataSources • What are you trying todetermine • Are you using the best datasource • Assessmentdata • Math • English Language Arts(ELA) 2019 OSEP LEADERSHIPCONFERENCE
How South Carolina Uses theData • Assessment • Professional Learning Opportunities(PLOs) • Annual State FocusedDeterminations • Discipline • Indicator4 • Annual State FocusedDeterminations 2019 OSEP LEADERSHIPCONFERENCE
Pros and Cons of Using Multiple DataSources • Pros • Allowscross-collaboration • Offers variety ofperspective • Supports better decisionmaking • Affects dataquality 2019 OSEP LEADERSHIPCONFERENCE
Pros and Cons of Using Multiple DataSources (cont.) • Cons • Limited scope orview • Restrictions • Affects dataquality 2019 OSEP LEADERSHIPCONFERENCE
Graduation Versus DropoutRates 100% 88.24% 77.78% 76.67% 73.85% 72.73% 80% 72.22% 71.43% 70.00% 69.89% 69.23% 60% 40% 20% 12.30% 4.20% 2.30% 2.70% 3.00% 3.00% 2.00% 1.60% 1.80% 1.40% 0% A B C D E F G H I J Districts GradRate DropoutRate 2019 OSEP LEADERSHIPCONFERENCE
Slide 11 2019 OSEP LEADERSHIPCONFERENCE
Determinations – Compliance FactorsScore Key(cont.) 2019 OSEP LEADERSHIPCONFERENCE
Compliance FactorsScoring Table 1: ComplianceScoring 2019 OSEP LEADERSHIPCONFERENCE
State PerformanceFactors *ELA and Math scores for 2015-2016 did not include alternativeassessment. 2019 OSEP LEADERSHIPCONFERENCE
Determinations – Performance FactorsScoring Key Table 2: Performance ScoringKey 2019 OSEP LEADERSHIPCONFERENCE
State PerformanceFactors Table 3: PerformanceData * Represents target for2017-2018 2019 OSEP LEADERSHIPCONFERENCE
Slide 17 2019 OSEP LEADERSHIPCONFERENCE
Example of Performance Factor byLEA Table 1:ComplianceScoring Table 2: Performance ScoringKey Table 3: PerformanceData * Represents target for2018. 2019 OSEP LEADERSHIPCONFERENCE
IDEA Part B Determinations by Number of LEAs– State DataSheet 45 40 35 30 25 20 15 10 5 0 40 2018 NeedsIntervention 2018 NeedsAssistance 2018 MeetsRequirements 19 12 5 3 2 1 2019 Needs Intervention 2019Needs Assistance 2019 Meets Requirements 2019 OSEP LEADERSHIPCONFERENCE
Distribution of LEAs by DeterminationLevel • 2016-2017 • Meets Requirements =17 • Needs Assistance =61 • Needs Intervention = 4 2017-2018 • Meet Requirements =32 • Needs Assistance =48 • Needs Intervention =2 2019 OSEP LEADERSHIPCONFERENCE
Maine’s Part C DataStory RoyFowler 2019 OSEP LEADERSHIPCONFERENCE 21
Maine Child DevelopmentServices • 9 regionalsites • 7 early intervention program managers • Transdisciplinary primary service provider (PSP) model used statewide • New data system Child Information Network Connection (CINC) implemented July 1,2016 2019 OSEP LEADERSHIPCONFERENCE
Data Analysis and Use Plan:Maine 2019 OSEP LEADERSHIPCONFERENCE
Data Elements and CollectionStrategies • From the Child Development Services (CDS)Database • Overall compliance percentage at the local and statelevels • Compliance percentage byservice • Number of consult services by Secondary Service Providers (SSP) on initial individualized family service plans(IFSPs) • Number of untimely/unused consultsessions • Compliance specific to the timeliness of consultservices • Service logs • Communicationlogs • OtherSources • Staff efficiencysheets 2019 OSEP LEADERSHIPCONFERENCE
Data AnalysisStrategies • DescriptiveAnalysis • Timely delivery of services by CDS RegionalSite • Timely delivery of services bydiscipline • Impact of consults/secondary service provision on timely delivery ofservices • Timeliness of consult services identified on initialIFSPs • Qualitative Analysis • Review of staff efficiency/productivitypercentages • Review of CommunicationLogs 2019 OSEP LEADERSHIPCONFERENCE
Plan for Using and Sharing theResults • Develop clear guidance on the appropriate use of consult services on initialIFSPs • Share the data with regional site-level Early Intervention (EI)teams • Identify the State and CDS Regional Site decrease in timely delivery ofservices • Share data that identifies the root cause ofdecrease 2019 OSEP LEADERSHIPCONFERENCE
Plan for Using and Sharing the Results(cont.) • Inform localprocesses • Review the developed guidance and implementation of thatguidance • Review a sampling of initial IFSPs and discuss the findings with the EI Team • Assess the impact on CDS Regional Site’s timely delivery of services at 3-, 6-, and 9-month intervals and review with the EITeam 2019 OSEP LEADERSHIPCONFERENCE
Results Timely Delivery of Services bySite YORK DOWNEAST FIRST STEP MIDCOAST PEDS OPPORTUNITIES AROOSTOOK REACH TWORIVERS 58% 94% 81% REGIONALSITE 91% 73% 60% 70% 57% 76% 10% 20% 30% 40% 50% PERCENTAGE OF TIMELINESS 0% 60% 70% 80% 90% 100% 2019 OSEP LEADERSHIPCONFERENCE
Results(cont.) Timely Delivery of Services by ServiceType SocialWorkConsultation AudiologyServices Family Training and CounselingConsultation OccupationalTherapy SpecialInstruction InterpretingServices Social WorkServices Speech andLanguageServices AssistiveTechnology Services Interpreting Services(ForeignLanguage) OccupationalTherapy Consultation Physical Therapy Consultation SpecialConsultation PhysicalTherapy Speech and Language Consultation 20% 50% 0% DISCIPLINE OF IFSPSERVICE 74% 81% 0% 58% 72% 7% 94% 24% 24% 25% 94% 21% 40% 50% 60% PERCENTAGE OFTIMELINESS 0% 10% 20% 30% 70% 80% 90% 100% 2019 OSEP LEADERSHIPCONFERENCE
Results(cont.) Impact of consults/secondary service provision (SSP) on timely servicedelivery With SSPsexcluded 76% With SSPsincluded 43% 40% 50% 60% PERCENTAGE OFTIMELINESS 0% 10% 20% 30% 70% 80% 90% 100% 2019 OSEP LEADERSHIPCONFERENCE
Results(cont.) Timeliness of consult services identified on initial IFSPs 22% Timely Untimely NotDelivered 14% 64% 2019 OSEP LEADERSHIPCONFERENCE
Key Observations From OurResults • Consult services identified on initial IFSPs have a significant impact on timely delivery ofservices • Most consult services identified on initial IFSPs are either untimely or notdelivered • Primary Service Provider services are significantly more timely than consult services identified on the initialIFSP • Staff with higher productivity percentages are more likely to provide timely services than those with lowproductivity 2019 OSEP LEADERSHIPCONFERENCE
LessonsLearned • Access to a large amount of data is valuable only if the data are reliable, analyzed, and actedupon • The use of data in decisionmaking ensures that resources are used efficiently and with properfocus • A thorough analysis of data and an easily understandable presentation of the results of that data analysis increase buy-in to proposedguidance • Ongoing monitoring of data allows for the identification of problems as they arise, the determination of the effectiveness of interventions, and potential need for adjustment of thoseinterventions 2019 OSEP LEADERSHIPCONFERENCE
Discussion • Developing and maintaining a culture of data requires a champion. How are you growing a culture of high-quality data at the state or local level? • Having heard from the panelists, think of an example of a local data use initiative in which you are engaged. What insights have you had and how do you see those insights affecting futureefforts? • How are you supporting your local districts and programs in improving their data quality? What are your biggest challenges? What strategies showpromise? 2019 OSEP LEADERSHIPCONFERENCE
ContactUs Heather Reynolds, heatherreynolds@westat.com Carolyn Bostick,cbostick@ed.sc.gov Roy Fowler,roy.fowler@maine.gov 2019 OSEP LEADERSHIPCONFERENCE
For MoreInformation Visit the IDCwebsite http://ideadata.org/ Follow us onTwitter https://twitter.com/ideadatacenter Follow us onLinkedIn http://www.linkedin.com/company/idea-data-center 2019 OSEP LEADERSHIPCONFERENCE
2019 OSEPLeadership Conference Slide 37 DISCLAIMER: The contents of this presentation were developed by the presenters for the 2019 OSEP Leadership Conference. However, these contents do not necessarily represent the policy of the Department of Education, and you should not assume endorsement by the FederalGovernment. (Authority: 20 U.S.C. 1221e-3 and3474) 37