Download
1 / 58
580 likes | 587 Vues
This presentation explores how to improve the balance between transportation and inventory in order to optimize financial statements. It discusses the impacts of shipment quantities on inventory and transportation costs, as well as practical implementation strategies.

E N D
ISyE 6203Inventory vs Transport John H. Vande Vate Spring 2012 1
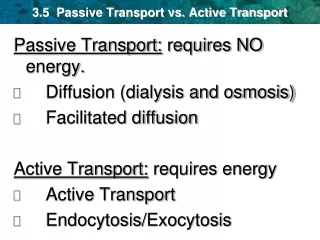
Team Presentations Financial Statements Transport & Inventory How’d you calculate? What would you do next as VP of SC? Improving the balance between transport & inventory Agenda 2
Transportation: $435 K Inventory: Green Bay: $900 K Indianapolis: $600 K Denver: $50 K Stores: $155 Million Pipeline: $1.654 million How to reduce inventory at stores? Our Company 3
Use full-truck load rates, but don’t fill the trucks Treat all stores the same What happens if we ship half a truck load instead of a full truck load? More generally? If we ship a quantity Q? First Step 4
Transportation Costs D = Annual Demand at the Store A = Transportation cost per shipment Annual Transport cost: AD/Q Note that’s because we pay for the full truck regardless of what’s on it. Inventory Costs at the Store h = Inventory holding cost % C = Value at COGs hCQ/2 Total Cost Formula 5
Total Cost Cost rises quickly as shipments get very small – move to a different mode or… Total cost typically flat so anything close to minimum is good 6
How does changing the shipment quantity Q affect pipeline inventory? Total Cost Formula 7
Minimize Total Cost • Total Cost (Q) = AD/Q + hCQ/2 • Simple incremental analysis: • Look at increasing Q by small amount ε • Incremental change in Inventory • +hCε/2 inventory impact to order ε more • Incremental change in Transportation • The increase in inventory is independent of Q • The decrease in transportation is declining in Q • Increase Q until the incremental transportation savings = incremental inventory increase, beyond that Total Cost increases again • Recognize this? 8
The EOQ • Increase Q until incremental savings in transportation = incremental increase in inventory • AD/Q2 = hC/2 • The Economic Order Quantity • Calculus: 9
The EOQ • Achieving Balance • AD/Q2 = hC/2 => AD/Q = hCQ/2 • Annual Transport Cost = Annual Inventory holding cost • If Transport Cost > Inventory holding cost, shipments are too large? Too small? • Our Company: • Transport Costs • Inventory Holding Costs at Stores • Inventory at Stores • Inventory Holding Costs at Stores • Conclusion? 10
Inventory at Source? • What about inventory at the Source? Green Bay, Indianapolis or Denver • Our Total Cost formula ignored inventory at the source • If we ship Q to every store, what will the Cycle Stock at Green Bay be? Q/2 • How does this affect our analysis? It changes the EOQ ever so slightly as we will see. 11
Inventory at Source? At the stores How does this affect our analysis? • Total Cost (Q) = 100 AD/Q + 100 hCQ/2 + hCQ/2 = 100 AD/Q + 101 hCQ/2 • So we want 100 AD/Q2 = 101 hC/2 At the plant So the adjustment to the EOQ really is slight 12
Determine the appropriate shipping quantities for Our Company Adjust the financial statements to reflect changes in transportation and inventory Discuss the impacts What would you, as VP of SC, do next? Two Parts 2A and 2B That’s due Tuesday, Jan 24th Our Company: Challenge 2 13
Do the simplest thing first, if it works and elaboration is worth the effort and added complexity, then elaborate If we ship a different quantity Qi to each store, what is the inventory impact at the source? Let’s first calculate the appropriate shipping quantities (and the financial impacts) if we treat all stores the same. Think more practically about what to do next. Challenge 2A 14
Elaborate on the simple model Calculate appropriate shipping quantities (and the financial impacts) Balance between impact and how practical it is to implement Treating each store separately is not practical Challenge 2B 15
Two Steps: What impact will this have on inventory at the source? Practicalities Does it make sense to have a separate quantity for each store? How would you implement that? What’s it worth? Is there a practical way to achieve most of the savings while avoiding most of the complexity? Treating different stores differently 16
Green Bay ships quantity Qi to store i, What’s the inventory impact at Green Bay What’s the appropriate quantity to ship Think about just one store. All we have to do is figure out the Cycle Stock contribution at Green Bay Impact at the Source 17
Worst Situation: Synchronized Shipments Ship to all 100 stores simultaneously Cycle stock at Green Bay: Qi/2 Assumption: Green Bay will allocate production to minimize Cycle Stock Rotate full attention to one (a small number of) store at a time, staggering shipments as much as possible. We will simply assume we can stagger shipments perfectly What’s the Cycle Stock? Cycle Stock at Green Bay 18
Look at shipments to 1 store They are of size Q How long to build up that shipment? P = Rate of production Cycle Stock Area = Item-days of inventory Q 19 Q/P
Green Bay Cycle Stock • item-days of inventory at the Green Bay accumulated for each shipment to Store #1 if the shipment size is Q Area = item-days of inventory Q 20 Q/P
Green Bay Cycle Stock • How many shipments to Store 1? D/Q • Total Item-days of inventory at Green Bay for Store 1: Area = item-days of inventory Q 21 Q/P
Green Bay Cycle Stock • Total Cost between Green Bay & Store 1 • Recognize this? 22
Economic Production Quantity • EPQ 23
Green Bay Cycle Stock • If we ship a different quantity for each store, Qi for store i, what’s the cycle stock at Green Bay • Store i contributes • So the total is • More generally • Or half the demand-weighted average shipment quantity D is the annual demand at a store. 24
Discussion • So the basic EOQ is good enough here • Many, similar customers • EPQ more relevant if there are few customers or large customers so that D and P are comparable • We will return to this 25
Frequency vs Quantity • Often more practical to set a regular schedule for replenishment, e.g., weekly or semi-weekly… • n = Shipments per year • Q = D/n (careful with units) • Total Cost (n) = AD/Q + hCQ/2 The cycle inventory at the plant 26
Frequency vs Quantity • Total Cost (n) • So that the best value for n is 27
Practical Approach • Simplify by grouping Stores into Frequency Bands • For example: • Band 1: Stores served once per 2-months • Band 2: Stores served once per month • Band 3: Stores served twice per month • Band 4: Stores served 3 times per month • The appropriate choices will depend on the “economics” • Observations: • Where will Band 1 stores be? • Where will Band 4 stores be? • Why? 28
Where’s Band 1, Band 4? • Normally think of the EOQ (EPQ) as • Given a fixed transportation cost defined by distance, find the appropriate frequency • Turn that around • Given a fixed frequency, find the appropriate transportation cost and so distance The higher the frequency the closer the stores should be 29
Dividing line between Bands • Dividing line between Band 1 and Band 2 • Band 1: Stores Served once per 2-months (6 times per year) • Band 2: Stores Served once per month (12 times per year) • Find the fixed cost (distance) A so that the total cost at n1 = 6 and at n2 = 12 shipments per year is equal That’s about 975 miles Stores closer than 975 are better served 12 times per year. Stores farther are better served 6 times per year. 30
Not necessary to pay full truck load rates for less-than-truck load shipments Can use LTL services YRC Worldwide Fedex Freight UPS freight ABF Freight System Old Dominion Freight Lines Estes Express Lines An excellent guide to using LTL services is available at LTL Training Manual Module 1 LTL Training Manual Module 2 LTL Training Manual Module 3 Changing Modes 31
LTL – Less-Than-Truckload: Carrier organizes transport via consolidation terminals Groupage: Similar concept, but organized by a forwarder who contracts with a carrier for transport. LTL
LTL LTL
LTL Rates LTL Cost Shoulder Constant rate Rate per CWT 34
Observations • Economies of Scale • Although the cost of larger shipments is higher, the rate is lower • This is generally true across modes: Parcel – LTL – TL – Rail Car … • Under LTL we only pay for the portion of the vehicle we use (but at the higher rate) 35
Observations • LTL rates depend on • Origin • Destination • Weight (in hundred weight CWT) • Class of freight • Includes density, value, … • So there are lots of LTL rates • Rating Engines • CzarLite, (SMC3 Southern Motor Carriers Rate Conference) • Radical Tools (MARS 500 Middlewest Motor Freight Bureau) 36
Available in the labs Excel Add-in Includes Zip code look up Zip code to City, State 3-digit zip to Zip Road distance between Zips Find the closest point in a set of Zips Find the cheapest (in terms of LTL rates) point Rate LTL shipments Rate Parcel shipments Radical Tools 37
Specific Example $/CWT TL Cost LTL Min Charge Shoulder Includes a 24.2% fuel surcharge After the 70% discount Pipeline impact 38 Download LTL Rate Worksheet from T-Square
Question • How do we determine the appropriate shipment size trading off LTL and TL rates and inventory carrying costs? • A first step: • Between 2,001 and 4,346 lbs the rate is $98.70 per CWT (before the 70% discount) or $29.61 after the discount • How do we think about how much to send in each shipment under this rate? • How is this different than FTL rates? 39
Question • A first step: • $29.61 per CWT vs $4851.68 per TL • What affect does making smaller shipments have on transport cost at the per CWT rate? • What affect does making smaller shipments have on inventory cost at the per CWT rate? • What shipment size is appropriate at the $29.61 per CWT rate? 40
Question • How do we determine the appropriate shipment size trading off LTL and TL rates and inventory carrying costs? • A second step: • Between 4,347 and 5,000 lbs the rate is $1287.15 regardless of weight. • How do we think about how much to send in each shipment under this rate? This is probably over-kill except perhaps at the top shoulders, e.g., 13,820 – 30,000 lbs 41
Determine the appropriate mode and shipping quantity from Green Bay to Store #2 in Los Angeles. Briefly describe the thinking behind your calculations Challenge 3 42
Roll this strategy out to all Stores. Determine the appropriate mode and shipping quantity to every store Remember to keep it practical. Briefly describe the thinking behind your calculations What are the impacts on SPEED, ROIC and Margin? What would you do next as VP of SC? Challenge 4 43
Low hanging fruit is mostly picked We are starting to find it requires more and more work to achieve smaller and smaller impacts The harder we have to work, the more complex we make the operations – diminishing our impact further We will have to think smart to be effective Ideas? Warning 44
Economies of Scale in Transport Class 70 LTL rates/lb from Green Bay to LA Shipment weight (lbs) 45
Questions? 46
Useful Tool: GIS Geographic Information System Links databases and maps Useful for addressing questions like: Where should we …? How far away are…? How are …. distributed? Intro To GIS
Spatial data Location Stored in a shape file, geodatabase, … Attribute data Associated characteristics Stored in DB GIS systems typically maintain these separately and “join” them for display or analysis GIS
Raster model Area covered by a grid of square cells Image data is a Raster model, cells = pixels Vector model Features represented as Points or nodes Lines or arcs Areas or polygons Geographic Data
Key Properties of Geo Data Projection: The method of translating locations on the 3-D earth to (X,Y) coordinates on a map or screen Scale: The ratio between distance on a map to the equivalent distance on earth Accuracy Positional: Is it in the right place? Consistency: Is it correctly categorized? Completeness: Is it all there? Resolution: e.g., pixel size Geographic Data