Download
1 / 39
390 likes | 401 Vues
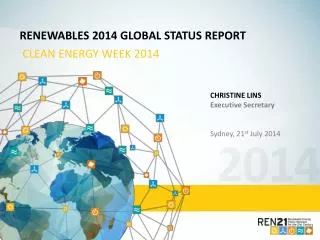
Key Facts and Figures from the REN21 Renewables 2011 Global Status Report. [EVENT] [Date, Location]. [Presenter, REN21 Secretariat]. About REN21. Founded in the Political Declaration of the International Conference for Renewable Energies , in Bonn, Germany, June 2004.

E N D
Key Facts and Figures from the REN21 Renewables 2011 Global Status Report [EVENT][Date, Location] [Presenter, REN21 Secretariat]
About REN21 • Founded in the Political Declaration of the International Conference for Renewable Energies, in Bonn, Germany, June 2004. • Multi-stakeholder Policy Network grouping:national to local governments, industry, academia, INGOs, NGOs, civil society • Rationale: enable a rapid global transition to renewable energy. • REN21’s Mission: Promote policies for worldwide renewable energy expansion through • objective policy guidance • high quality information • exchange among relevant actors REN21 Renewables 2011 Global Status Report
Organisation of REN21 • REN21 Steering Committee • ca. 40 experts & individuals representing the stakeholder groups • REN21 Bureau REN21 network REN21 network • REN21 Secretariat • (coordinated by UNEP + GIZ) REN21 Renewables 2011 Global Status Report REN21 network REN21 network
REN21 Renewables Global Status Report www.ren21.net/gsr • Annualpublication since2005 • Comprehensive overview of global renewable energy situation & key trends • Global Market Overview, Investment Flows, Industry Trends, Policy Landscape, Rural Renewable Energy… • All renewable energy technologies • Sectors: power, heating/cooling, transport • NO analysis, potentials, forecasting • team of over 150 researchers & reviewers worldwide • Lead author (Janet Sawin) & Chapter authors • Technology contributors & Regional contributors • REN21 Secretariat research support team REN21 Renewables 2011 Global Status Report www.ren21.net/GSR
Renewable Energy in 2010 Renewables 2011 Global Status Report REN21 Renewables 2011 Global Status Report • In 2009, RE supplied an estimated 16% of global final energy consumption • Global energy consumption rebounded in 2010 (+5,4%) after downturn in 2009 • Renewable energy, which experienced no downturn in 2009, continued to grow strongly in all end-use sectors • Distinct RE markets: power, heating/cooling, transport, rural energy
Renewable Energy in 2010 Renewables 2011 Global Status Report REN21 Renewables 2011 Global Status Report • From the end of 2005 through 2010, global capacity of many renewable energy technologies grew at rates ranging 15% to nearly 50% annually • Solar PV increased the fastest, followed by biodiesel and wind • In several countries the growth rates for these RET far exceed global average
Global Market Overview – Power Markets REN21 Renewables 2011 Global Status Report • Renewable energy power capacity worldwide reached 1,320 GW (+8%) in 2010 • Renewable energy delivered close to 20% of global electricity production • Renewable capacity comprises about 25 % of total global power-generating capacity • RE accounted for roughly half of the 194 GW of new power generating capacity
Investment Flows REN21 Renewables 2011 Global Status Report • Total global investment in RE jumped in 2010 to a record of $211 billion and exceeded: • $226 billion including estimated $15 billion invested in solar hot water • ~$270 billion including the $40–45 billion invested in large hydropower (>50 MW). • Total investment in new RE capacity(excluding large hydro) was $203 billion • For the first time, financial new investment in RE in developing countries surpassed that in developed economies. • China attracted nearly $50 billion, making it the leader for the second year in a row
Industry Trends Key Trends • RE industry saw continued growth in manufacturing, sales and installation • Costreductions(especially in PV) contributed to growth • Trends: • Internationalisation • Industry consolidation (notably in the biomass and biofuelsector) as traditionalenergycompaniesmovedintho RE • Development of verticallyintegratedsupplychains • Changingpolicylandscape in many countries industryuncertainties and negativeoutlook • Worldwide jobs in renewableenergy industries exceeded3.5 million in 2010. China, Brazil, and Indiaaccount for a large share of jobs REN21 Renewables 2011 Global Status Report
Policy Landscape Policy Targets • Doubling of countries with RE targets or policies in five years:55 in 2005 to 118 in early 2011. • Targets in at least 96 countries;more than half are developing countries. • Manytargets and policiesalsoexistatstate, provincial and local levels. • Targets represent commitments to: • Shares of electricity (typically 10–30%) • Total primary energy • Heat supply • Installed capacities of specific technologies, • Shares of biofuelin road transport fuels over 1-2 decades. • Many countries met 2010 targets (some data not available), some exceeded. REN21 Renewables 2011 Global Status Report
Policy Landscape REN21 Renewables 2011 Global Status Report
Rural Renewable Energy • Wide range of viable and cost-competitive alternatives to traditional biomass energy and to grid electricity and carbon-based fuels that can provide reliable and sustainable energy services. • In Africa, more than 500,000 solar PV systems were in use in 2007, with more than half of these in South Africa and Kenya. • Beyond these two countries, most African solar home system (SHS) or pico-PV system projects are relatively small, although there are encouraging developments. • Progress in Asia is also notable. Under China’s Renewable Energy Development project, which ended in mid-2008, more than 400,000 SHS were sold to residents of northwestern China. REN21 Renewables 2011 Global Status Report
The Renewables Interactive Map Home Page • Informs on renewableenergypolicy • Tracks worldwide RE development • Gathers and shares information on RE policy and development • Provides automatic & easy to use reports REN21 Renewables 2011 Global Status Report www.map.ren21.net
The Renewables Interactive Map Searching by Technology and Sector • Search by technologies or sectors • Technology specific, or non technology specific • Refine searches according to: • Policies • Targets • Shares • Installed capacity • Production • Potential • RE economy • Automatic, customized and easy to use reports REN21 Renewables 2011 Global Status Report
Thank You • Further Information: • [Email address presenter] • REN21 Secretariat • rana.adib@ren21.netwww.ren21.net • www.ren21.net/gsr • www.map.ren21.net REN21 Renewables 2011 Global Status Report
Additional slides • In the followingyouwillfindadditionalslideswhichcould serve if youwouldlike to add more detailed information on specifictopics
General Information • Global marketoverview • InvestmentFlows • Policy Landscape
Global Market Overview - Power Markets MARKET OVERVIEW: POWER • Existing renewable energy power capacity worldwide reached 1,320 GW, almost + 8% from 2009 • Top five countries for renewable power (including hydro):China, United States, Canada, Brazil, India, Germany
Investment Flows Investment by Region • Top countries for total investment in 2010 : China, Germany, US , Italy, Brazil • For the first time, financial new investment in RE in developing countries surpassed that in developed economies. • China attracted $49 billion (up 28% over 2009): More than two-thirds of developing country investment & more than a third of global investment. • India ranked eigthin the world for RE investment, which rose 25% to $3.8 billion. • New investment in Brazil dropped 5% to $7 billion (focus on consolidating biofuel sector, investment in mergers and acquisitions). • Largest increases in renewable investment in Latin America (excluding Brazil). • In developing regions, Africa saw largest RE investments after China, India and Brazil: Total African investments rose $750 million to $3.6 billion. REN21 Renewables 2011 Global Status Report
Investment Flows Investment by Type • Asset finance of new utility-scale RE projects (wind farms, solar parks, biofuel and solar thermal plants), reached $128 billion in 2010, almost 60% of the total • Represents an increase of 20% over 2009, which had seen a drop of 6%compared to 2008. • China and US accounted for more than half of new build asset finance in 2010. • Utility-scale asset finance dominated by wind (70%). • Venture capital and private equity investment in renewable energy companies increased 19% over 2009, to $5.5 billion. • Public RE investment increased 23% in 2010, to $15.4 billion • Research and development (R&D) on RE rose to $9 billion in 2010. REN21 Renewables 2011 Global Status Report
Investment Flows Development & National Bank Finance • State-owned multilateral and bilateral development banks have been pillars of investment in RE during recent, troubled years for the world economy. • More public money to the RE sector through development banks than through government stimulus packages. • Data compiled by BNEF show that 13 development banks worldwide provided $13.5 billion of finance for RE projects in 2010 • Up from $8.9 billion in 2009, $11 billion in 2008, and just $4.5 billion in 2007. • Three leading development banks in RE project finance: • European Investment Bank ($5.4 billion) • Brazil’s BNDES ($3.1 billion) • Germany’s KfW ($1.5 billion). REN21 Renewables 2011 Global Status Report
Policy Landscape Power GenerationPolicies • Renewable power generation policies exist in at least 96 countries, more than half of which in developing countries or “emerging economies” • Feed-in tariffs (also called premium payments, advanced renewable tariffs, and minimum price standards) remain most common RE power generation policy. • By early 2011, at least 61 countries and 26 states/provinces had FITs, more than half of which had been enacted since 2005. • Net meteringisimplemented in 14 countries • Manyadditional types of policiesare beingimplemented to support renewables power generation : direct capital investment subsidies, grants or rebates; taxincentives, energyprodictiopayments or credits, public financing REN21 Renewables 2011 Global Status Report
Policy Landscape Heating & CoolingPolicies, Green Power Policies • Heating and CoolingPolicies • RE heating and cooling policies not enacted as aggressively or rapidly, as electricity or transport biofuels policies. • Recent policies for RE heating and cooling favor regulatory approaches that mandate energy shares or equipment requirements. • Mandates for solar hot water in new construction represent a strong and growing trend at both the national and local levels. • Green Power • Green power purchasing and utility green pricing programs are growing • Growth aided by: Supporting policies; Private initiatives; Utility programs; Government purchases: > 6 million green power consumers globally. • Germany the green power leader: 0.8 million residential customers in 2006 to 2.6 million in 2009. REN21 Renewables 2011 Global Status Report
Policy Landscape Transport Policies, City & Local Government Policies • Transport Policies • Fuel blending mandates now exist in 31 countries at the national level and in 29 states/provinces around the world. • Fuel-tax exemptions and production subsidies exist in at least 19 countries, including 10 EU countries and four developing countries. • Reductions of support schemes resulted in closure of some biofuel plants. REN21 Renewables 2011 Global Status Report • City & Local Government Policies • More and more local governments are setting targets for increasing the generation and use of renewable energy. • Interest in aiming for 100% local renewablesis growing, mainly among smaller communities that face a simpler transition process. • Role of cities, local governments in international climate policy has also strengthened in recent years.
Global MarketOverview & Industry Trends • Wind • SolarPhotovoltaics • Solar Thermal • ConcentratingSolar Thermal Power (CSP) • Geothermal • Biomass • Biofuels (Bioethanol, Biodiesel) • Hydropower • Ocean Energy
WindGlobal Market Overview • 39 GW new wind capacity in 2010: more than any other RET • Existing capacity increased more than 24% relative to 2009 • At least 83 countries use wind power on commercial base • For the first time, majority of new turbine capacityadded in developing countries and emergingmarkets • China accounted for half global market MARKET OVERVIEW: POWER
Wind Industry Trends • Manufacturing volumes steady at 2009 levels. • Manufacturing capacity increased substantially during 2010 REN21 Renewables 2011 Global Status Report • Industry leaders all lowered sales forecasts during 2010(low natural gas prices, access to project finance, access to transmission). • Growth opportunities mainly in China and other emerging markets • Trends: offshore development, distributedsmall-scalegridconnected turbines, increased turbine size.
Solar Photovoltaics Global Market Overview • PV fastest growing power-generation technology in 2010 (+72% compared to 2009 capacity) • Roughly 17 GW of PV added worldwide in 2010 • Global total of 40 GW more than 7x the capacity in operation 5 years earlier • PV capacityadded in more than100 countries • EU accounted for 80% of the global PV market • Vastmajorityinstalled PV capacitygrid-connected MARKET OVERVIEW: POWER
Solar Photovoltais Industry Trends REN21 Renewables 2011 Global Status Report • An estimated 23.9 GW of cells and 20 GW of modules produced in 2010: A doubling of production over 2009 levels. • The top 15 solarcell manufacturer produced55% of the global production • Cellmanufacturingcontinueditsshift to Asia- 10 of the 15 largestmanufacturers. • 2009 PV cost reductions continued in 2010, with module prices falling a further 14%
Solar Thermal Global Market Overview • Solar thermal technologies becoming widespread. • Solar water & space heating capacity increased by ~25 GWth, or about 16% in 2010. • Total installedcapacityreached185 GWth • China added an estimated17.5 GW • EU accounted for most of remaining added capacity. • New installations in EU declined due to economic recession. REN21 Renewables 2011 Global Status Report
Solar Thermal Industry Trends • China has dominated the world market for solar water heating for several years and is also the world leader in manufacturing. • More than 5,000 firms are active in the Chinese industry and start entering markets in Africa, Central & Latin America, but also Europe. • In Europe, the industry has been marked by a shift toward increased use of combined systems for hot water and space heating. • Perhaps also add that some traditional markets have seen slower growth due to economic crisis and lower natural gas prices? REN21 Renewables 2011 Global Status Report
Concentrating Solar Thermal Power (CSP) Global MarketOverview & Industry Trends • Strong development after years of inactivity: ~ 740 MW added between 2007 and end-2010 • More than half of this added in 2010. • CSP growth expected to continue at a rapid pace: Nearly 1GW in Spain, and 1.5GW in US under construction in early/mid 2011. • Industry activity continued to focus on leading markets of Spain and the US, but attention also moves to MENA region and China. • PV costreductionsare challengingthe growing CSP markets (ex. US) • Spanish industry leads in CSP plant design and operation with over 80 firms. REN21 Renewables 2011 Global Status Report
Geothermal Global MarketOverview & Industry Trends • Global geothermalelectricity production accounts for 67.2 TWh, an increase of more than20%. • Global installed capacity just over 11 GW, 240 MW added in 2010 • Geothermal power plants operating in at least 24 countries by early 2011 with largeste plants commissioned in New Zealand (0.1 GW), Italy (0.04 GW), Kenya (~0.04 GW) • Continued rise of direct geothermal energy in 2010: ~ 51 GWth • Use of heat from geothermal sources increased by almost 9% over past decade. • At least 78 countries using direct geothermal heat in 2010 (72 in 2005, 58 in 2000). • US industry global leader: Developing one-third of global new projects (all in its domestic market) • Japanese firms Mitsubishi, Toshiba, and Fuji Electric supply 70% of the steam turbines at geothermal plants worldwide. REN21 Renewables 2011 Global Status Report
Biomass Global MarketOverview & Industry Trends • Modern biomass (solid, liquid, gas) provides majority of renewable energy heating for cooking, heating water and space, process heat. • Worldwide use of modern biomass for heat totaled 11,600 PJ in 2008 (most recent available global data). Markets in EU expanding steadily. • ~ 234.5 PJ (5.6 mtoe) heat from solid biomass and biogas sold into district heat markets in Europe during 2009: 97% using solid biomass • Biomass use for power production: Significant increases in 2010 in a number of European countries, the United States, China, India, several other developing countries. • Estimated 62 GW of biomass power capacity was in place globally, by end 2010. • Diverse industry, mainly centered in Europe, driven by EU targets, national action plans (despite fiscal austerity). • Notable trends: • Growth of wood pellet production facilities • Developmentof industryscalebiogas plants and biomethane injection into the naturalgasgrid REN21 Renewables 2011 Global Status Report
Biofuels (Bioethanol, Biodiesel) Global Market Overview • Increased competition from new biodiesel markets (Canada, Argentina, Indonesia). • Subsequent slowdown in traditionally dominant EU markets. REN21 Renewables 2011 Global Status Report • Global biodiesel production increased 7.5% in 2010, to nearly 19 billion liters • EU center of global biodiesel production: More than 10 billion liters and representing nearly 53% of total output in 2010. • Global fuel ethanol output ~86 billion liters: +17% over 2009. • United States and Brazil accounted for 88% of ethanol production in 2010. • US alone: 57% of the total ethanol production. Brazil losing market share.
Biofuels (Ethanol, Biodiesel) Industry Trends • Ethanol • Ethanol industry recovered in 2010 in response to rising oil prices. • Ethanol manufacturers in 29 U.S. states operated a total of 204 plants with a capacity of 51 billion liters. • Traditional oil companies continued entering the biofuel sector (acquisitions) • In Brazil during 2010, multiple vertically integrated sugarcane groups emerged in the ethanol space (previously occupied only by market leader Cosan). • Biodiesel • EU producers continued to lead the biodiesel industry, but operated at an average of 50% capacity or lower (rising rapeseed oil costs, cheaper imports) • In Brazil, biodiesel production increased 50%, mostly in response to a domestic biodiesel blending mandate of 5%. 68 biodiesel plants operating in Brazil REN21 Renewables 2011 Global Status Report
HydropowerGlobal Market Overview & Industry Trends • Hydropower production increased more than 5% in 2010: due largely to new capacity and wet weather in China. • Hydropower represented about 16% of global electricity production. • ~ 30 GW of capacity added in 2010. Global capacity reached ~ 1,010 GW • Hydropower in use in some150 countries: Highestinstalledcapacity in Asia, thenEurope, Northand South America, withAfricaa distant 5th • Largest active hydropower industry is in China with hundreds of small entrepreneurs, municipal governments, as well as a number of large players. • Emerging markets mainly Asia and Latin America • Developed markets focused on repowering, relicensing, and pumped storage development. REN21 Renewables 2011 Global Status Report
Ocean Energy Global Market Overview & Industry Trends • Least mature renewable energy technology: Growing interest and activity. • Handful of pre-commercial projects generating power with a range of technologies in 2010. • At least 25 countries involved in ocean energy development activities • Wave and tidal technologies saw progress toward commercial generation in 2010, benefiting from government policies, financial grants, and new entrants. • Industry focus on design and evaluation of demonstration prototypes. • A number of traditional hydropower firms and utilities joined the industry. REN21 Renewables 2011 Global Status Report
The Renewables Interactive Map Searching with the Map – Country Result • Clickable world map allows graphicalsearching • Criteriaspecific results display comprehensive RE information • Criteria-specific reportseasilygenerated and printed. • Extraction of databasefor use in other applications REN21 Renewables 2011 Global Status Report