Download
1 / 7
70 likes | 284 Vues
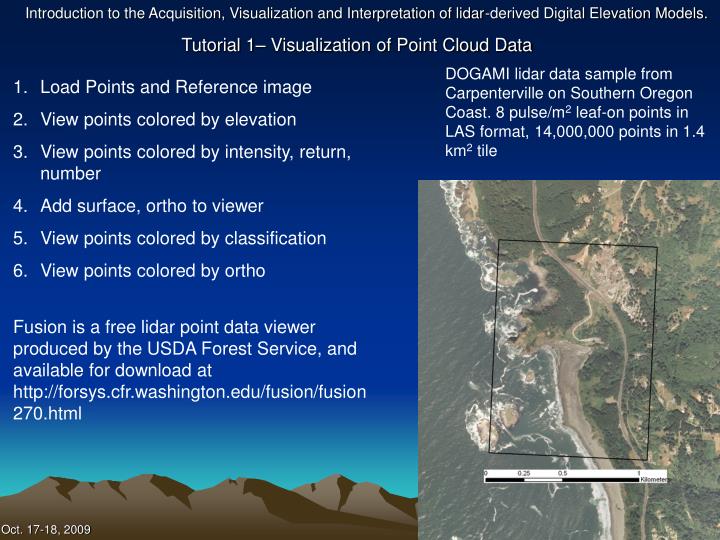
DOGAMI lidar data sample from Carpenterville on Southern Oregon Coast. 8 pulse/m 2 leaf-on points in LAS format, 14,000,000 points in 1.4 km 2 tile. Load Points and Reference image View points colored by elevation View points colored by intensity, return, number Add surface, ortho to viewer

E N D
DOGAMI lidar data sample from Carpenterville on Southern Oregon Coast. 8 pulse/m2 leaf-on points in LAS format, 14,000,000 points in 1.4 km2 tile • Load Points and Reference image • View points colored by elevation • View points colored by intensity, return, number • Add surface, ortho to viewer • View points colored by classification • View points colored by ortho Fusion is a free lidar point data viewer produced by the USDA Forest Service, and available for download at http://forsys.cfr.washington.edu/fusion/fusion270.html
Load points and reference image • Launch Fusion • Load data from LAS file 42124B3317 • Load Image 42124b3317_ortho • Select Tools> Miscellaneous Utilities> Examine LAS file headers • Note number of points, ratio of returns, lack of projection info • If no image is available, use Tools> Miscellaneous Utilities> Create an image using lidar point file • Select LAS file for input, select output name • Select Clamp data range and run
View points by elevation • In Sample options, choose color by height, all returns, stroked box • Draw selection box on image • Initial display will be slow while Fusion indexes data • LDV viewer will pop up with image • Experiment with navigation, mouse to rotate view, ctrl and mouse to zoom • Right click on screen to bring up menu, select spinning side view or wiggle vision
View points colored by intensity, return, number • In Sample options, choose color by intensity, all returns, stroked box • Draw selection box on image • Note that intensity values are not normalized • Return to sample options switch to color by return • Note the ratio of first to second and third returns • Return to sample options, switch to color by pulse number • This visually sorts pulses from adjacent swaths
Add surface, ortho to viewer • In Sample options, choose color by height • Draw selection box on image • Right click on screen in LDV, click on ortho image, select 42124b3317_int to load intensity image which is a 1.5 ft pixel raster made from the first returns intensity values • Right click in LDV again and click on image plate • Use I/i to raise and lower image through points. • Spacebar to bring up menu, click on surface file, choose be3317_dem.dtm • Play with image • Make the DTM using Tools> Terrain Model> Import ESRI ASCII raster file
View points colored by classification • In Sample options, choose color using LAS classification, choose truncate attribute range, set minimum = 1, maximum = 2, set start color to white • Draw selection box on image, examine point cloud • Right click on screen in LDV, click on colors, set background color to white • Image will now display only ground points
View points colored by image • In Sample options, choose color using image • Draw selection box on image, examine point cloud • Points are now colored with values from corresponding location in ortho_image • Use ctrl +/- to change point size