Download
1 / 57
570 likes | 688 Vues
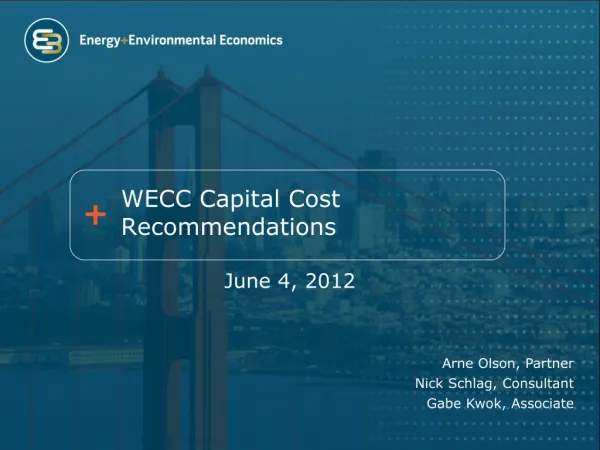
WECC Capital Cost Recommendations. June 4, 2012. Arne Olson, Partner Nick Schlag, Consultant Gabe Kwok, Associate. History. In 2009, E3 provided WECC with recommendations for capital costs of new electric generation technologies to use in its 10-year study cycles

E N D
WECC Capital Cost Recommendations June 4, 2012 • Arne Olson, PartnerNick Schlag, ConsultantGabe Kwok, Associate
History • In 2009, E3 provided WECC with recommendations for capital costs of new electric generation technologies to use in its 10-year study cycles • Prior to this effort, the relative costs of WECC’s study cases could only be compared on a variable-cost basis (using PROMOD results) • This effort provided WECC with a framework to quantify relative scenario costs on a basis reflecting their actual prospective costs to ratepayers by combining variable & fixed costs • In 2011, WECC asked E3 to review the capital costs to ensure continued accuracy • Due to the continued evolution of solar PV technologies, E3 lowered its estimates of photovoltaic capital costs Total Cost Fixed Costs (E3 Capital Cost Tool) Variable Costs (PROMOD) = +
Background • In the midst of its 10- and 20-year study plans, WECC has asked E3 to provide guidance on resource cost and performance to use in those studies • These capital costs will serve as inputs to the 10- and 20-year studies: • Including capital costs in the 10-year study cycles enables comparisons of total costs between scenarios • Capital costs will serve as an input to the 20-year study’s LTPT, allowing for the development of robust scenarios through cost minimization
Updates • E3 presented its initial recommendations to stakeholders on May 15, 2012 • Based on stakeholder feedback and comments, E3 has reviewed its recommendations for wind and solar costs • Minor revisions were made to several of the present day solar PV costs to better capture expected cost differentials between system types and sizes • E3 has revised some of the data inputs used to forecast of cost declines for solar PV and solar thermal technologies: • Forecasts of installed capacity for solar PV and solar thermal have been revised to account for near-term projections of global market dynamics • Learning rate for solar thermal has been adjusted to reflect greater potential for technological improvements than originally anticipated
Modeling Framework Resource Portfolio Total Scenario Costs PROMOD Resource Performance (NREL) 2022 Study Capital Costs (E3 Capital Cost Tool) Resource Performance (WREZ) LTPT/NXT Resource Portfolio Total Scenario Cost 2032 Study Capital Costs (E3 Capital Cost Tool)
Scope of Updates • E3’s Capital Cost Tool considers a broad range of potential new generation technologies • The scope for E3’s update is divided into two phases: • Near term (integrated in this year’s study cycle): update costs for wind and solar technologies • Long term (integrated into subsequent study cycles): review costs for all technologies • This division prioritizes updating those costs that are most likely to have changed given the limited time before the start of this study cycle Technologies in E3’s Capital Cost Tool
Technologies Covered • E3’s current update encompasses the following technologies—an expanded set compared to the original Capital Cost Tool Solar PV Solar Thermal Wind • Large Utility (20 MW +) • Fixed Tilt • Tracking • No Storage • 6hrs Storage • Onshore Modeled in Prior WECC Studies • Small Utility (1-20 MW) • Fixed Tilt • Tracking • Rooftop • Commercial • Residential New to This Year’s Study Cycle New technology characterizations are needed to represent increasing specificity of photovoltaic resources modeled by WECC, especially in the High DG/DSM Case
Approach • Determine the cost to install a power plant today (2012) • Given limited time, focus is on wind and solar technologies • Prior recommendations for other technologies are carried forward • Use learning curves to forecast declines in technology capital costs over the next two decades • Determine the appropriate applicability of federal tax incentives for renewable technologies over the 10- and 20-year study cycles • Develop and apply updated regional multipliers to capture geographic variations in resource costs around the WECC
Notes on Resource Performance • With the limited time available before the commencement of the present study cycles, E3’s present scope of work focuses on updating resource costs • WECC staff is developing assumptions on resource performance for use in the current study cycle • Over a longer timeframe, E3 will work with WECC to ensure that cost and performance assumptions are consistent with one another and represent our best expectations of future development patterns
Present-Day Costs • To derive estimates of present-day wind and solar costs, E3 has reviewed a wide range of recent studies and publications • For developing technologies, precise capital costs are a moving target that are difficult to pin down • A review of literature provides both… • …outdated forecasts of what costs would be today; and • …retrospective analysis of actual costs from several years ago • E3 has used this information to develop its best estimates of costs to install wind and solar plants in 2012 • All costs are expressed in 2010 dollars
Historical Trends in Solar PV Costs • Installed solar PV costs continue to decrease: • Average U.S. behind-the-meter PV data from 1998-2010 (Left) • California Solar Initiative (CSI) data from 2009-2011 (right) • CSI is focused on rooftop PV • Less data available for utility-scale PV and solar thermal • Tracking the Sun IV: An Historical Summary of the Installed Cost of Photovoltaics in the United States from 1998 to 2010 • California Solar Statistics
Current Trends in Solar PV Prices Market data and experience have shown substantial movement in PV prices over the past two years, suggesting we are on a relatively steep portion of the “learning curve.” This makes identifying current prices a challenging exercise. Source: Technical Potential for Local Distributed Photovoltaics in California
Historical Trends in Wind Costs • Average 2010 installed cost was similar to 2009 • 2010 Wind Technologies Market Report (June 2011)
Solar PV – Fixed Utility (20 MW+) • TEPPC 2011 • Current Update Capital costs for solar PV technologies shown here are expressed relative to the DC nameplate rating. To convert to an AC capital cost, these costs should be multiplied by 1.18 (assuming DC-AC conversion of 85%).
Solar PV – Tracking Utility (20 MW+) • TEPPC 2011 • Current Update Capital costs shown relative to DC nameplate rating
Solar PV – Fixed Utility (1-20 MW) • Technology has not been represented in past WECC modeling efforts Capital costs shown relative to DC nameplate rating
Solar PV – Tracking Utility (1-20 MW) • Technology has not been represented in past WECC modeling efforts Capital costs shown relative to DC nameplate rating
Solar PV - Commercial • Technology has not been represented in past WECC modeling efforts Capital costs shown relative to DC nameplate rating
Solar PV - Residential • Technology has not been represented in past WECC modeling efforts Capital costs shown relative to DC nameplate rating
Solar Thermal – Without Storage • TEPPC 2011 • Current Update
Solar Thermal – With Storage • TEPPC 2011 • Current Update
Wind • TEPPC 2011 • Current Update
Recommended Resource Costs Cost Summary (2010 $) Capital costs for solar PV are converted from DC to AC by multiplying by 1.18 (assuming DC-AC conversion of 85%).
Comparison of Updated Costs to Prior Recommendations Cost Summary (2010 $)
Considerations in Forecasting Technology Cost • Technology cost changes • As nascent technologies become increasingly mature, they may experience cost declines as a result of learning by doingand increased scale of manufacturing • Technology costs are sensitive to other factors as well: • Trends in the costs of raw materials • Relationship of supply and demand • Tax credit expiration • ITC for solar technologies is set to expire in 2017 • PTC for wind expires in 2013; for other technologies in 2012
Learning Curve Theory • Learning curves describe an observed empirical relationship between the cumulative experience in the production of a good and the cost to produce it • Increased experience leads to lower costs due to efficiency gains in the production process • The functional form for the learning curve is empirically derived and does not have a direct theoretical foundation • The learning rate (LR) is used to describe the expected decrease in costs with a doubling of experience The theory of learning curves in economics was formalized by Kenneth Arrow in 1962 in “The Economic Implications of Learning by Doing”. This empirical relationship has since been affirmed in a number of works that span many sectors of the economy.
Learning Curves and Solar PV • Declines in solar PV module price have tracked the functional form of the learning curve with a learning rate of approximately 20% since 1976 Past performance does not indicate future potential Recent cost reductions have not followed the longer-term trends of historical learning Source: Global Overview on Grid-Parity Event Dynamics (Breyer and Gerlach)
Learning Curves and Solar PV • Module costs represent only a fraction of solar PV system costs; total system costs have historically declined at a slightly lower learning rate (~17%) Source: Navigant Consulting
Uncertainty in Future Costs • Past trends do not guarantee future declines, and other factors influence technology costs Pessimistic Path Optimistic Path • Today’s low prices caused by excess supply followed by a rebound as markets re-equilibrate • Cost of raw materials rise • Int’l markets saturate and US growth slows as the ITC expires • Solar PV continues to reap benefits of a high learning rate • Global installed capacity grows rapidly
Uncertainty in Global Installed Capacity • Future growth of solar PV can vary widely, as shown by the IEA’s 2010 Energy Technology Perspectives scenarios • IEA BLUE, High Renewables: renewables serve 75% of load in 2050 • IEA BLUE Map: global CO2 emissions reduced to half of 2005 levels • IEA Baseline: business-as-usual; no new policies affect energy sector
Sensitivity of Learning Curves to Global Installations Forecast • The choice of a forecast of future installations has a significant impact on anticipated future cost declines • The impact of an additional MW of capacity declines as the cumulative installed capacity increases Forecast declines based on a 10% learning rate
Near-Term Outlook for Solar PV • E3 has reviewed additional predictions of trends in global installed capacity for solar PV • The European Photovoltaic Industry Association’s Global Market Outlook predicts between 208 and 343 GW of solar PV by 2016 Moderate Scenario:pessimistic market behavior, reduced policy support for PV development Policy Driven Scenario:continuation of support mechanisms (FiTs) and strong political favor for solar PV
Forecasting Solar PV Global Installations Through 2032 • Short-term market outlook is generally consistent with IEA’s long-term vision • The average trajectory of the EPIA’s forecasts results in approximately 1,000 GW of solar globally by 2030 • E3 uses the average of the EPIA-derived long-term forecasts to forecast cost reductions for solar PV
Solar PV Learning Rate Recommendation • E3 recommends a learning rate of 10% for solar PV, which is applied to the entire capital cost (not just modules) • No guarantee that historical rates (17%) will continue • Learning rates for mature technologies (coal & gas) have decreased with technology maturation • As balance-of-systems components begin to represent larger shares of system costs, learning rates are likely to decrease • Coupled with the EPIA-derived long-term PV forecast, this learning rate yields the following estimates of long-term cost reductions
Forecasting Solar Thermal Global Installed Capacity by 2032 • IEA’s BLUE Map Scenario includes 600 GW of solar thermal capacity by 2050 • To reach this goal, solar thermal global installed capacity would have to reach approximately 200 GW by 2030 • European Solar Thermal Electricity Association’s Solar Thermal Electricity 2025 anticipates a cumulative total between 60 and 100 GW by 2025—substantially less • E3 has developed a forecast based on the ESTELA forecast that reflects lower anticipated near-term installations of solar thermal facilities • Total global capacity installed by 2032 is forecast to be 51 GW Aspirational Pessimistic
Solar Thermal Learning Recommendation • Based on stakeholder feedback, a learning rate of 10% was selected for solar thermal • Combined with the forecast of global installed capacity from the prior slide, this learning rate yields the following projection of solar thermal cost reductions:
Wind Learning Recommendation • Wind is a much more mature technology than either solar PV or solar thermal, with a global installed capacity of close to 200 GW • Estimates of learning rates for wind range from 0% - 15%; E3 has adopted a rate of 5% • In combination with IEA’s BLUE Map scenario (2,000 GW of wind by 2050), this assumption results in a 12% reduction in wind capital costs by 2032
Federal Tax Credit Landscape • Current federal tax policy provides large incentives to wind and solar developers: • Accelerated depreciation (5-yr MACRS for wind and solar) • Investment tax credit (30% of capital costs for solar) • Production tax credit ($22/MWh for wind)
Expiration of Federal Tax Credits • Federal tax credits are scheduled to retire in the near future • Investment tax credit reverts from 30% to 10% in 2017 • Production tax credit ($22/MWh for wind) expires in 2013 • PTC for other technologies expires in 2014 • The 5-year MACRS, as part of the general tax code, is assumed to remain in place
Combined Impact of Tax Credit Expiration and Technology Learning • Increased resource costs resulting from the expiration of tax credits are largely offset by technological progress over the next two decades
Recommended Resource Costs AC Capital Costs by Installation Year (2010 $/kW) Recommendations that have been modified since May 15 are highlighted in orange
Resulting LCOEs Levelized Cost of Energy by Installation Year (2010 $/MWh)
Average vs. Marginal • The cost to install one additional MW of solar in 2022 will not equal to the average cost of the solar resources installed between present day and 2022 • A large fraction of the solar resources installed by 2022 will have been installed gradually over the next decade
Recommendations for Installed Cost Vintages • To account for the many mitigating factors that will affect resource development over the, E3 recommends using the 2015 installed cost for resources installed in the first decade and the 2027 installed cost for resources installed in the second decade • To simplify this analysis, E3 also recommends assuming that the PTC is extended through the same time horizon as the ITC, expiring in 2017 First Decade Second Decade • Most new resources (especially solar) will come online relatively soon to claim tax credits • The choice of 2015 for “average” resource costing reflects this expectation • No resources can claim tax credits • Year-by-year development of renewables is highly uncertain, so the midpoint of the range (2022-2032) is used as a basis for installed costs