Download
1 / 32
320 likes | 455 Vues
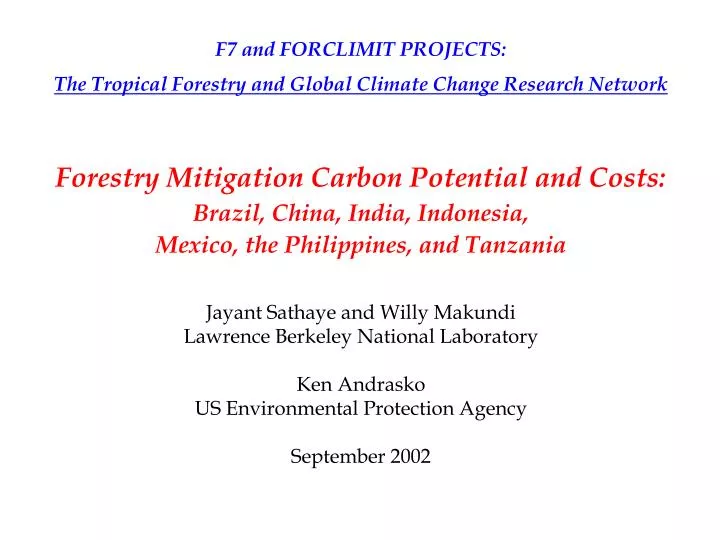
F7 and FORCLIMIT PROJECTS: The Tropical Forestry and Global Climate Change Research Network Forestry Mitigation Carbon Potential and Costs: Brazil, China, India, Indonesia, Mexico, the Philippines, and Tanzania Jayant Sathaye and Willy Makundi Lawrence Berkeley National Laboratory

E N D
F7 and FORCLIMIT PROJECTS: The Tropical Forestry and Global Climate Change Research Network Forestry Mitigation Carbon Potential and Costs: Brazil, China, India, Indonesia, Mexico, the Philippines, and Tanzania Jayant Sathaye and Willy Makundi Lawrence Berkeley National Laboratory Ken Andrasko US Environmental Protection Agency September 2002
Mitigation Analysis • Goal: • Estimate the carbon mitigation potential and costs of forestry options • Scale: • National or regional level analysis • Project-specific analysis • Confined to a specific geographic location, time period and institutional framework so as to allow changes in GHG emissions attributable to the project to be monitored and verified
F7 Project Description • National and regional level mitigation analysis • Studies conducted by country-specific modeling teams • LBNL provides technical support, training and outreach • All analyses use the same model • COMAP accounting approach • Data:National statistics on land use patterns, carbon benefits and costs of mitigation options, timber and non-timber prices, etc.
F7 and FORCLIMIT Participating Research Groups (F7 since 1990) • ASIA: • CHINA -- Xu, Deying (IPCC Lead Author, LULUCF Report), Forest Ecology and Environment Institute, Beijing • INDIA -- Dr. N.H. Ravindranath (IPCC Coordinator, LULUCF Report, CLA for Tech Transfer, and LA for WGIII Report, Consultant to UNFCCC), Indian Institute of Science, Bangalore • INDONESIA -- Prof. Rizaldi Boer (UNFCCC Consultant), Bogor Agriculture University, Bogor (co-funding with EAP) • MALAYSIA -- Dr. Roslan Ismail (ITTO Board, IPCC LA), SustechAsia.com Sdn Bhd., and Prof. Azman Abidin, UPM, Malaysia (via EAP funding) • PHILIPPINES -- Prof. Rodel Lasco (IPCC Lead Author, LULUCF Report), University of the Philippines, Los Banos (via EAP funding) • AFRICA: • TANZANIA -- (Yonika Ngaga, CEEST, Dar es Salam, and Dr.Willy Makundi, LBNL, LULUCF and WGIII Lead Author) • LATIN AMERICA: • MEXICO -- Prof. Omar Masera, IPCC CLA LULUCF and LA Tech Transfer and WG III reports, National University of Mexico • BRAZIL -- Dr. Philip Fearnside, IPCC, CLA LULUCF and LA WGII, National Institute for Research in the Amazon (INPA), Manaus
Mitigation Analysis -- Steps • Identify and characterize mitigation options • For national or regional level analysis • Project land-use change scenario(s) • Estimate annual carbon flows and equilibrium carbon • Vegetation, soils, products • Estimate annual monetary flows • Costs – establishment, siliviculture, maintenance, etc. • Benefits – timber and non-timber products • Compare costs and carbon flows to estimate $ / tC
Comprehensive Mitigation Analysis Process (COMAP) 5. Estimate Net Carbon Sequestration Per Ha by Mitigation Options (Vegetation, Soils, Understory, Litter & Wood Product) 1. Identify and Screen Potential Mitigation Options 9. Discuss Barriers to and Policies Needed for Implementation 10. Assess Macro-Economic Effects of Scenarios (Jobs, Capital, Exports, GDP, etc.)-India 4. Determine Land Area and Wood Production Scenarios by Option 7. Develop Scenarios of Total Cost and Carbon Seques-tration by Mitigation Option 2. Assess Current and Future Forest and Agriculture Land Use Patterns 8. Evaluate Cost- Effectiveness Indicators for Ranking Mitigation Options 6. Estimate Unit Costs and Benefits by Mitigation Option 3. Assess Current and Future Wood Product Demand
1. Selection and Characterization of Options Mitigation Options • Regeneration – Natural and Enhanced • Short and Long-rotation Plantations • Agroforestry • Forest Protection • Forest management • Bioenergy
Option Initial Cost ($/ha) Rotation Period (yrs) Mean Annual Increment (t C/ha/yr) 1. Short-rotation 2. Long-rotation 3. Regeneration/ Management 4.Protection/ Conservation 150 – 450 450 – 700 18 – 40 5 – 10* 7 –8 25 – 40 40 – 80 3.8 – 19.2 1.6 – 11.1 0.8 – 3 1.1 Forestry Mitigation Options In Study Countries: Key Assumptions * Excludes opportunity costs of land, which vary substantially across countries. These are accounted for in the estimates for each study country.
Country Total land area (‘000 ha) Forested Area (‘000 ha) Defrstion Rate Study Area (‘000 ha/yr) Potential This Study (000’s ha) Potential Trexler/Haugen (000’s ha) Brazil 845,700 390,000 1113 – 2906 85,000 85,000 China (3 regions) 963,296 115,600 60 31,953 India 328,760 63,300 274 53,200 35,000 Indo-nesia 192,401 104,500 750-1,500 31,000 13,600 Mexico 196,700 115,652 720 21,000 35,500 Phili-ppines 30,000 5,200 99 4,400 8,000 Tanzania 89,161 41,857 750 7,500 11,100 Total 2,556,857 837,593 Not Applicable 234,053 188,200 2.Historical land-use characteristics
2.2. Land-use Scenarios • Brazil -- Scenarios based on potential identified in literature • China -- Two scenarios based on government plans • Forestation of 80% and 60% of suitable land area in 30 years in three regions -- South West, South East, and North East. • India -- Sustainable and commercial forestry scenarios analyzed • Indonesia -- Government plansscenario, and a mitigation scenario were analyzed. The latter meets all wood demand by 2010. • Philippines -- Forestation rates of 100% and 50% ofgovernment plansin two scenarios. • Mexico -- Baseline (likely trends) and mitigationscenario analyzed • Mitigation consists of reduced deforestation rates, better forest management, and plantations meet commercial wood demand • Tanzania - The Tropical Forest Action Plan (TFAP) scenario, assuming that 3.5 Mha and 1.7 Mha land area is converted are analyzed.
Comprehensive Mitigation Analysis Process (COMAP) 5. Estimate Net Carbon Sequestration Per Ha by Mitigation Options (Vegetation, Soils, Understory, Litter & Wood Product) 1. Identify and Screen Potential Mitigation Options 10. Discuss Barriers to and Policies Needed for Implementation 9. Assess Macro-Economic Effects of Scenarios (Jobs, Capital, Exports, GDP, etc.) 4. Determine Land Area and Wood Production Scenarios by Option 7. Develop Scenarios of Total Cost and Carbon Seques-tration by Mitigation Option 2. Assess Current and Future Forest and Agriculture Land Use Patterns 8. Evaluate Cost- Effectiveness Indicators for Ranking Mitigation Options 6. Estimate Unit Costs and Benefits by Mitigation Option 3. Assess Current and Future Wood Product Demand
3. Carbon Accounting • Four carbon pools are accounted for • Above- and below-ground biomass, detritus, soils and products • Carbon accounting is on an equilibrium value basis • Annual balance is reported for vegetation carbon • All accounting is with respect to a reference case or baseline carbon
3.1Carbon Accounting Forest Protection: Mitigation Scenario Carbon Stock Forest Protection: Baseline Scenario Natural regeneration T Plantation operated in rotation 0.5 T Time
3.2 Vegetation Carbon Stock in Study Countries 30000 1200 1000 25000 800 Mitigation Scenario Mitigation 600 Baseline Scenario Baseline 20000 400 200 0 Mt C 15000 2000 '12 '30 Philippines 10000 5000 0 2000 '12 '30 2000 '12 '30 2000 '12 '30 2000 '12 '30 2000 '12 '30 2000 '12 '30 Mexico Indonesia China India Philippines Tanzania
4. Benefit / Cost Accounting • Costs include • Establishment or first costs • Recurring costs -- maintenance and monitoring • Opportunity cost of land • Benefits include • Revenue from sale of timber and non-timber products -- fruits, honey, etc. • Accounting is with respect to a reference case or baseline cost and benefits
4.1 -- Regeneration Project: Accounting of Carbon and Costs G Carbon Stock Time O T R I Annual Cost U V T Time O R
4.2 -- Forest Conservation Project:Accounting of Carbon and Costs Y X O Mitigation Scenario E A Carbon Stock Z Baseline Scenario V B F T Tp Mitigation Scenario M C Annual Cost Baseline Scenario D L Tp T O Time
4.3 -- Plantation Project Harvested in Rotation:Accounting of Carbon and Costs Carbon Stock A G B 0.5 G T O Time R N M Annual Cost K O T R Time
4.4 Evaluation of Project Costs A: Cost of a LULUCF project Total Costs C: Annualized cost of a LULUCF project B: Discounted present value of cost series A Converging series Time
5. Forestry Mitigation Potential, Indonesia Cost ($/t C) DR = 10% 100 Forest Protection 50 Reforestation Bioenergy Reforestation Rotation Short - - Enhanced Natural Rotation Long - - Regeneration Long - Rotation Plantation 0 0 500 1000 1500 2000 2500 Reduced Impact Logging - 50 - 100 Short - Rotation Plantation - 150 Cumulative Carbon Mitigation Potential (Mt C), 2000-2030
Cost ($/ t C) DR = 8-12% 23 1 CHSE SRP 13 CHSE LRP 25 INS REF SRP = Short - Rotation Plantation BR = Brazil 2 CHSW REG 14 BR LRP 26 PHI LRP REG = Regeneration CH = China 3 CHSW SRP 15 IND REG 27 MEX AGF LRP = Long - Rotation Plantation NE = Northeast 4 CHNE REG 16 PHI REG 28 INS RIL BIO = Bioenergy SE = Southeast 5 MEX LRP 17 MEX SRP 29 PHI FPR LRH = Long - Rotation Hardwood SW = So uthwest 6 PHI SRP 18 MEX BIO 30 IND SRP SRS = Short - Rotation Softwood IND = India 7 CHSE REG 19 TAN LRH 31 MEX REG FMG = Forest Management INS = Indonesia 8 CHSW LRP 20 TAN SRS 32 INS REF ENR = Enhanced Natural MEX = Mexico 9 CHNE SRP 21 MEX FM G 33 INS BIO Regeneration SRC = Community Short - Rotation PHI = Phillipines 10 INS SRP 22 INS LRP 34 INS FPR REF = Reforestation TAN = Tanzania 11 CHNE LRP 23 INS ENR 35 IND LRP AGF = Agroforestry 12 BR SRP 24 TAN SRC 36 IND FPR RIL = Reduced Impact Logging 5.2 Forestry Mitigation Potential (Brazil, China, India, Indonesia, Mexico, Philippines and Tanzania) $600 Negative cost potential about half the total 36 $400 $200 35 33 34 24 27 26 31 29 20 32 25 21 16 $0 30 14 28 22 12 19 18 0 1000 2000 3000 4000 5000 6000 7000 10 17 8 13 15 11 9 7 ($200) 6 5 4 3 ($400) ($600) 2 ($800) ($1,000) 1 Cumulative Carbon Mitigation Potential (Mt C), 2000 - 2030
Cost ($/ t C) DR = 8-12% 23 1 CHSE SRP 13 CHSE LRP 25 INS REF SRP = Short - Rotation Plantation BR = Brazil 2 CHSW REG 14 BR LRP 26 PHI LRP REG = Regeneration CH = China 3 CHSW SRP 15 IND REG 27 MEX AGF LRP = Long - Rotation Plantation NE = Northeast 4 CHNE REG 16 PHI REG 28 INS RIL BIO = Bioenergy SE = Southeast 5 MEX LRP 17 MEX SRP 29 PHI FPR LRH = Long - Rotation Hardwood SW = So uthwest 6 PHI SRP 18 MEX BIO 30 IND SRP SRS = Short - Rotation Softwood IND = India 7 CHSE REG 19 TAN LRH 31 MEX REG FMG = Forest Management INS = Indonesia 8 CHSW LRP 20 TAN SRS 32 INS REF ENR = Enhanced Natural MEX = Mexico 9 CHNE SRP 21 MEX FM G 33 INS BIO Regeneration SRC = Community Short - Rotation PHI = Phillipines 10 INS SRP 22 INS LRP 34 INS FPR REF = Reforestation TAN = Tanzania 11 CHNE LRP 23 INS ENR 35 IND LRP AGF = Agroforestry 12 BR SRP 24 TAN SRC 36 IND FPR RIL = Reduced Impact Logging 5.3 Forestry Mitigation Potential (Brazil, China, India, Indonesia, Mexico, Philippines and Tanzania) $600 Negative cost potential about half the total 36 $400 Hypothetical Carbon Price $200 35 33 34 24 27 26 31 29 20 32 25 21 16 $0 30 14 28 22 12 19 18 0 1000 2000 3000 4000 5000 6000 7000 10 17 8 13 15 11 9 7 ($200) 6 5 4 3 ($400) ($600) 2 ($800) ($1,000) 1 Cumulative Carbon Mitigation Potential (Mt C), 2000 - 2030
6. Conceptual Figure: Impact of barriers on costs and carbon mitigation potential F7 Estimate – Socioeconomic Potential Economic Potential Market or Achievable Potential ?? Cost of carbon ($/t C) ?? Market Failures: Examples Ill-defined property rights Lack of information Absence of markets Poor capital markets Barriers: Examples Carbon leakage Class structure Gender Issues Attitudes and habits Technical Potential Carbon sequestered or emissions avoided (t C)
2000-2012 2000-2030 Cumulative (Mt C) Annual average (Mt C/yr) Cumulative (Mt C) Annual average (Mt C/yr) F7 Study 1,851 140 6199 200 All-Tropics 2,730 210 9,028 290 Carbon Benefits: Mitigation Options in F7 Studies
Future Work • Estimating mitigation potential of projects taking barriers into consideration • Land tenure, rural cultures, risk-averse behavior, lack of product markets, etc. • Project-specific analysis of forestry mitigation options • Establishing approaches to resolve issues of baselines, permanence, and leakage • FORCLIMIT Project • Evaluation of one case study to better understand key LULUCF issues about leakage and permanence • Global COMAP Model development
Key Concerns about Climate Change Projects • Tests for additionality and credibility of baselines • Estimating and controlling GHG leakage • Monitoring and verification of GHG emissions and carbon stock • Permanence: Duration of carbon stocks of a LULUCF project • Sustainability concerns about LULUCF projects The above issues, except permanence, are of concern to all climate change projects, although their impact varies by type of project
Leakage • Reduced access to land, food, fuel and timber resources without offering alternatives may result in carbon leakage as people find needed supplies elsewhere • A few pilot projects have been designed to reduce leakage • Multi-component projects: (CARE/Guatemala) increases fuelwood availability and agricultural productivity by encouraging agroforestry • Significant leakage may require assessments outside the project boundary • Difficult if the assessment is across national boundaries