Download
1 / 67
710 likes | 885 Vues
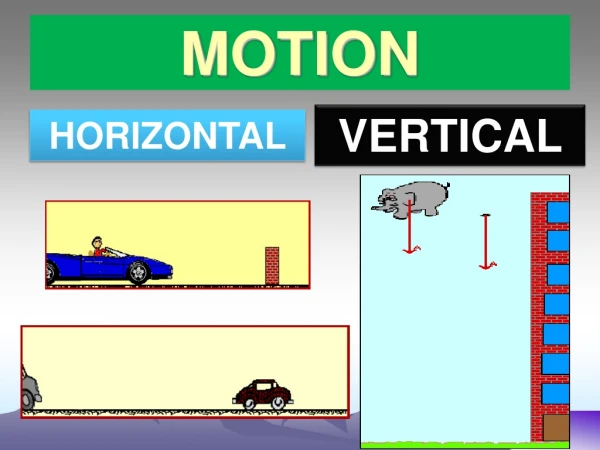
MOTION. Chapter Four: Motion. 4.1 Position, Speed and Velocity 4.2 Graphs of Motion 4.3 Acceleration. Position is a variable given relative to an origin. 4.1 Position, Speed and Velocity. The origin is the place where position equals 0.

E N D
Chapter Four: Motion • 4.1 Position, Speed and Velocity • 4.2 Graphs of Motion • 4.3 Acceleration
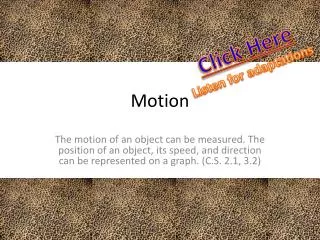
Position is a variable given relative to an origin. 4.1 Position, Speed and Velocity • The origin is the place where position equals 0. • The position of this car at 50 cm describes where the car is relative to the track.
Position and distance are similar but not the same. If the car moves a distance of 20 cm to the right, its new position will be 70 cm from its origin. 4.1 Position, Speed and Velocity Distance = 20 cm New position
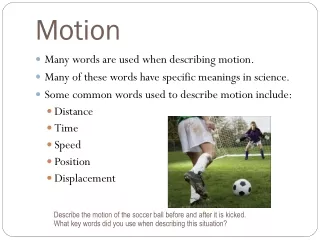
The variable speed describes how quickly something moves. To calculate the speed of a moving object divide the distance it moves by the time it takes to move. 4.1 Position, Speed and Velocity
The units for speed are distance units over time units. This table shows different units commonly used for speed. 4.1 Position, Speed and Velocity
When you divide the total distance of a trip by the time taken you get the average speed. On this driving trip around Chicago, the car traveled and average of 100 km/h. 4.1 Average speed
A speedometer shows a car’s instantaneous speed. The instantaneous speed is the actual speed an object has at any moment. 4.1 Instantaneous speed
Solving Problems How far do you go if you drive for two hours at a speed of 100 km/h? • Looking for: • …distance • Given: • …speed = 100 km/h time = 2 h • Relationships: • d = vt • Solution: • d = 100 km/h x 2 h = 200 km = 200 km
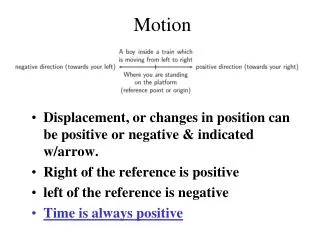
4.1 Vectors and velocity • Position uses positive and negative numbers. • Positive numbers are for positions to the right of the origin and negative numbers are for positions to the left the origin.
4.1 Vectors and velocity • Distance is either zero or a positive value.
4.1 Vectors and velocity • We use the term velocity to mean speed with direction.
4.1 Keeping track of where you are • Pathfinder is a small robot sent to explore Mars. • It landed on Mars in 1997. • Where is Pathfinder now?
4.1 Keeping track of where you are • Pathfinder keeps track of its velocity vector and uses a clock. • Suppose Pathfinder moves forward at 0.2 m/s for 10 seconds. What is Pathfinder’s velocity?
4.1 Keeping track of where you are • Suppose Pathfinder goes backward at 0.2 m/s for 4 seconds. What is Pathfinder’s change in position?
4.1 Keeping track of where you are • The change in position is the velocity multiplied by the time.
4.1 Keeping track of where you are • Each change in position is added up using positive and negative numbers. • Pathfinder has a computer to do this.
4.1 Maps and coordinates • If Pathfinder was crawling on a straight board, it would have only two choices for direction. • Out on the surface of Mars, Pathfinder has more choices. • The possible directions include north, east, south, and west, and anything in between.
4.1 Maps and coordinates • A graph using north−south and east−west axes can accurately show where Pathfinder is. • This kind of graph is called a map. • Street maps often use letters and numbers for coordinates.
4.1 Vectors on a map • Suppose you run east for 10 seconds at a speed of 2 m/s. • Then you turn and run south at the same speed for 10 more seconds. • Where are you compared to where you started?
4.1 Vectors on a map • To get the answer, you figure out your east−west changes and your north−south changes separately. origin = (0 , 0)
4.1 Vectors on a map • Your first movement has a velocity vector of +2 m/s, west-east (x-axis). • After 10 seconds your change in position is +20 meters (east on x-axis). d = v x t d = 2 m/s x 10 s = +20 m
4.1 Vectors on a map • Your second movement has a velocity vector of −2 m/s north−south (y-axis) • In 10 seconds you move −20 meters (south is negative on y-axis) New position = (+20 , -20) d = 2 m/s x 10 s = -20 m
Solving Problems A train travels at 100 km/h heading east to reach a town in 4 hours. The train then reverses and heads west at 50 km/h for 4 hours. What is the train’s position now? • Looking for: • …train’s new position • Given: • …velocity = +100 km/h, east ; time = 4 h • …velocity = -50 km/h, west ; time = 4 h • Relationships: • change in position = velocity × time
Solving Problems • Solution: • 1st change in position: • (+100 km/h) × (4 h) = +400 km • 2nd change in position: • (−50 km/h) × (4 h) = −200 km • Final position: • (+400 km) + (−200 km) = +200 km • The train is 200 km east of where it started.
2.3 Graphing • A graph is a visual way to organize data. • A scatterplot or XY graphis used to see if two variables are related.
2.3 Graphing • A bar graphcompares data grouped by a name or category.
2.3 Graphing • A pie graph shows the amount each part makes of up of the whole (100%).
2.3 Graphing • A “connect-the-dots” line graph is often used to show trends in data over time.
2.3 How to make an XY graph • Scatterplotsshow how a change in one variable influences another variable. • The independent variable is the variable you believe might influence another variable. • The dependent variable is the variable that you hope will change as a result of the experiment.
2.3 How to make an XY graph • Pressure is critical to safe diving. • How does an increase in depth affect the pressure? • What sort of graph would best show the relationship between pressure and depth?
2.3 How to make an XY graph • Choose x and y-axis • Depth is the independent variable = x axis • Pressure is the dependent variable = y axis • Make a scale • Most graphs use ones, twos, fives or tens • OR calculate the value per box • Plot your data • Create a title * Exception- when time is a variable
2.3 Identifying graph relationships • In a direct relationship, when one variable increases, so does the other. The speed and distance variables show a direct relationship.
2.3 Identifying graph relationships • When there is no relationship the graph looks like a collection of dots. No pattern appears.
2.3 Identifying graph relationships • In an inverse relationship, when one variable increases, the other decreases.
2.3 Reading a graph What is the speed of the car at 50 cm? • Find the known value on the x axis • Position = 50 cm • Draw a line vertically upward from 50 cm until it hits the curve. • Draw a line across horizontally to the y-axis from the same place on the curve. • Read the speed using the y axis scale. • Speed = 76 cm/s
4.2 Graphs of Motion • Constant speed means the speed stays the same. • An object moving at a constant speed always creates a position vs. time graph that is a straight line.
4.2 Graphs of Motion • The data shows the runner took 10 seconds to run each 50-meter segment. • Because the time was the same for each segment, you know the speed was the same for each segment.
4.2 Graphs of Motion • You can use position vs. time graphs to compare the motion of different objects. • The steeper line on a position vs. time graph means a faster speed.
4.2 Slope • The slope of a line is the ratio of the “rise” to the “run”. • The steepness of a line is measured by finding its slope.
4.2 Graphs of changing motion • Objects rarely move at the same speed for a long period of time. • A speed vs. time graph is also useful for showing the motion of an object that is speeding up or slowing down.
4.2 Graphs of changing motion • On the graph, the length is equal to the time and the height is equal to the speed. • The area of the rectangle is equal to its length times its height. • Suppose we draw a rectangle on the speed vs. time graph between the x-axis and the line showing the speed.