Download
1 / 7
70 likes | 280 Vues
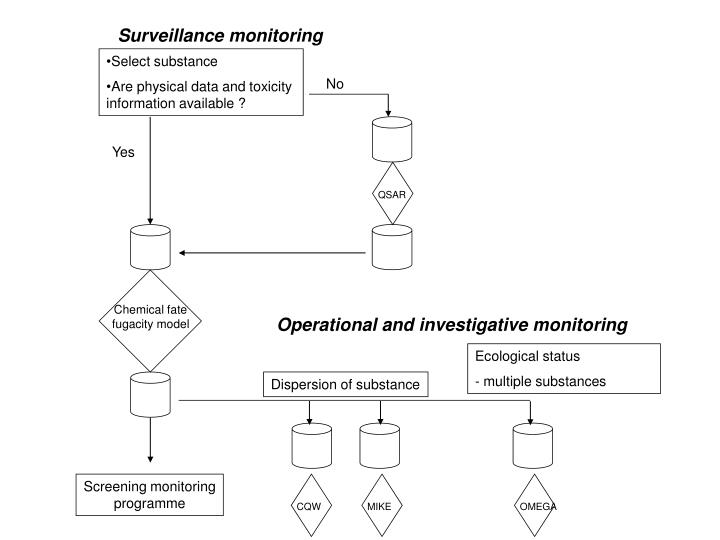
QSAR. CQW. MIKE. OMEGA. Chemical fate fugacity model. Surveillance monitoring. Select substance Are physical data and toxicity information available ?. No. Yes. Operational and investigative monitoring. Ecological status - multiple substances. Dispersion of substance.

E N D
QSAR CQW MIKE OMEGA Chemical fate fugacity model Surveillance monitoring • Select substance • Are physical data and toxicity information available ? No Yes Operational and investigative monitoring Ecological status - multiple substances Dispersion of substance Screening monitoring programme
Data required for the Fugacity model Environmental Properties: areas and depths for all bulk media volume fractions for all subcompartments densities for all subcompartments organic carbon content (soil, sediment & suspended sediment only) fish lipid content (Type I chemicals only) advective flow residence times for air (including aerosols), and water (including suspended sediment and aquatic biota) advective flow residence time for sediment burial transport velocities - air side air-water mass transfer coefficient - water side air-water mass transfer coefficient - rain rate - aerosol deposition velocity (wet and dry combined) - soil air phase diffusion mass transfer coefficient - soil water phase diffusion mass transfer coefficient - soil air boundary layer mass transfer coefficient - sediment-water mass transfer coefficient - sediment deposition velocity - sediment resuspension velocity - soil water runoff rate - soil solids runoff rate Chemical Properties: chemical name molecular mass data temperature reaction half-life estimates for - air- water- soil- sediment- aerosols- suspended sediment- aquatic biota Type 1 chemicals - water solubility- vapour pressure- log Kow- melting point Type 2 and 3 chemicals - partition coefficients
Fugacity model The fugacity modelling approach was introduced by Mackay et al., and can be considered to be a distribution-modelling tool based on the concept of fugacity (Mackay, 1991 and 2001). The fugacity, f [Pa], is a normalised measure of the concentration of a substance within a phase (solid, liquid or gaseous). f=Zi+Ci Zi is defined as the fugacity capacity [mol m-3 Pa-1], the escaping tendency of a substance from the phase i. Each phase has a set of defined transport velocity parameters, their D values [mol Pa-1 h-1]. When combined with mass flow equations, degradation kinetics (e.g., the half-lives of the substance in the included phases) and the spatial parameterisation of a certain area, the fugacity modelling approach can give valuable information on the distribution of the substance between different phases (‘compartments’) in the environment. The models also provide information on residence time, accumulation and concentrations. In order to include the unsteady-state dynamics of the substances being emitted to the Compartments of the model, the calculating algorithm needs to handle and solve the Differential equation; Vi being the volume of the compartment i, Zi its bulk fugacity capacity, Ii is the input rate, each term Djifj represents intermediary input transfers and DTifi is the total output. Link to level III fugacity model EQC (Mackay et al, downloadable freeware) http://www.trentu.ca/academic/aminss/envmodel/models/VBL3.html
Output of the Fugacity model partition coefficients (Type 1) Z values fugacity of each medium intermedia transport rates and D values reaction and advection D values and loss rates residence times or persistences (overall, reaction, and advection) concentrations and amounts for each medium a summary diagram charts of key results
Input for QSAR A measured descriptor is usually a physical property of the compound, e.g. partition coefficients, refractive index or light absorption, and requires that the substance is available Calculated descriptors on the other hand, do not require that the substance is isolated in the laboratory; it may not even have been synthesized, since all that is needed is the chemical structure. A further classification of calculated descriptors is into zero, one, two and three dimensional depending on how they are dependent on the chemical structure. Zero and one-dimensional descriptors only depend on the number of different atoms and functional groups. Two dimensional descriptors depend on the connectivity between atoms while three-dimensional also depend on the conformation of the molecule. The single most important descriptor used in QSAR is hydrophobicity, which is usually measured as the logarithm of the octanol/water partition coefficient, log KOW
QSAR models Descriptor calculation can be made using the software Dragon (Talete srl, Italy). Dragon requires a 3-D structure as input. Often, quantum or molecular mechanics software is used for 3D optimization of chemical structures. However, such software is often expensive and optimization can be very time consuming for large structures. An alternative is rule-based 3D structure estimation, which is faster and considered to be sufficiently accurate. A summary of the methods and software used for descriptor calculation is as follows: 1. CAS number is transformed to SMILES strings using information from public databases. 2. CORINA is used to transform the SMILES string to 3D mol files. 3. DRAGON was used to calculate descriptors from the mol files Partial least squares (PLS) regression is used, which is a latent variable regression method. One of the main advantages of latent variable regression methods are the possibility for prediction outlier detection offered. It is extremely important to note that empirical models are not validated outside the domain in which they are trained, i.e. a QSAR model cannot be applied to substances that are too dissimilar to the substances in the training data. Link to level III fugacity model EQC (Mackay et al, downloadable freeware) http://www.trentu.ca/academic/aminss/envmodel/models/VBL3.html Link to REBECCA project homepage http://www.environment.fi/default.asp?contentid=230500&lan=EN
Output of QSAR models For many substances, physical properties and chronic toxicity may not be available. A QSAR model is a relation between chemical structure and a property of the chemical compound.