Download
1 / 14
140 likes | 247 Vues
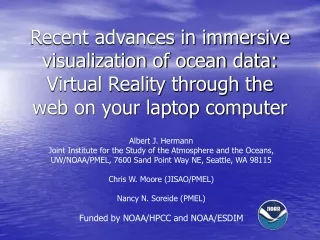
Immersive Visualization of the circulation and biology of the Northeast Pacific using spatially nested model output. Albert J. Hermann Joint Institute for the Study of the Atmosphere and the Oceans, UW/NOAA/PMEL, 7600 Sand Point Way NE, Seattle, WA 98115 Enrique N. Curchitser (LDEO)

E N D
Immersive Visualization of the circulation and biology of the Northeast Pacific using spatially nested model output Albert J. Hermann Joint Institute for the Study of the Atmosphere and the Oceans, UW/NOAA/PMEL, 7600 Sand Point Way NE, Seattle, WA 98115 Enrique N. Curchitser (LDEO) Dale B. Haidvogel (Rutgers) Elizabeth L. Dobbins (UW/NOAA/PMEL) Sarah Hinckley (NOAA/AFSC) Christopher W. Moore (UW/NOAA/PMEL)
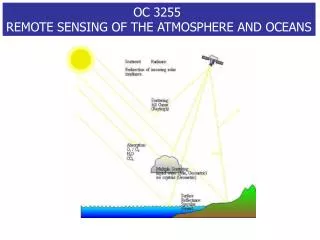
The Problem: Huge Datasets • 3D models with >106 grid points, long simulations, multiple scales • How to visualize? • Simple contours and vectors • Shaded plots, colored vectors • Surfaces in three dimensions • Float paths • Surfaces and floats viewed with binocular (stereo) vision -> immersion (virtual reality) A set of nested models for the Pacific
What do we gain by immersion? • Surfaces reveal all scales of 3D features; contour plots hide smaller scales, patchy distributions (e.g. “clouds”) • Eulerian velocities / Lagrangian paths really are 3-dimensional! Examine u,v,w vectors and paths of animated particles (or fish) • Binocular vision reveals spatial information quickly; faster exploration of data via “real world” type of experience
Immersive techniques • Shutterglasses ($$ - $$$$) • alternate left eye/right eye view rapidly in time; wear shutterglasses to synchronize vision in left/right eye with left/right images on monitor • Autostereo ($$$) • No glasses required, special monitor with lenses • Polarization ($$$) – Superimpose two images with different polarization of light; wear passive polarized lenses to view • Anaglyphs ($1) • Superimpose two images with different color (red/blue); wear passive colored lenses to view – just like 3D comics!
Nested Biophysical Models for GLOBEC: NCEP/MM5 -> ROMS/NPZ -> IBM
NESTED CIRCULATION MODEL DOMAINS NEP CGOA NPac
Immersive ROMS visualization • Northeast Pacific (NEP) physics • conduct sensitivity experiments • use immersive visualization to explore differences between resulting fields • Coastal Gulf of Alaska (CGOA) physics and biology • use immersive visualization to explore patchy biology and physics at fine scales
NEP El Nino sensitivity experiments • “Standard” run with • NCEP daily surface forcing (VW) • NPac 3-day averages as BC (VBC) • “Climatological” run using • monthly climatology of NCEP surface forcing (CW) • monthly climatology of NPac BC (CBC) • VW with CBC • CW with VBC
GLOBEC NPZ model for the CGOA (S. Hinckley) Width of arrow represents N flux
Albatross Bank Kodiak Island Chlorophyll Lo N Lo N Chlorophyll Hi N Hi N Portlock Bank