Download

1 / 36
370 likes | 658 Vues
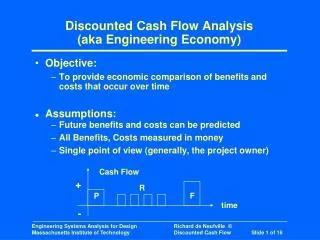
ICFI. Using Discounted Cash Flow Analysis to Make Investment Decisions Project Analysis. By : Else Fernanda, SE.Ak., M.Sc. Topics Covered. Identifying Cash Flows Discount Cash Flows, Not Profits Discount Incremental Cash Flows Discount Nominal Cash Flows by the Nominal Cost of Capital

E N D
ICFI Using Discounted Cash Flow Analysis to Make Investment Decisions Project Analysis By : Else Fernanda, SE.Ak., M.Sc.
Topics Covered • Identifying Cash Flows • Discount Cash Flows, Not Profits • Discount Incremental Cash Flows • Discount Nominal Cash Flows by the Nominal Cost of Capital • Separate Investment & Financing Decisions • Calculating Cash Flows
Applying the Net Present Value Ruleto Real World Situations Making Investment Decisions using NPV involves the following steps: • Forecast project cash flows • Estimate the opportunity cost of capital • Use the opportunity cost to discount the cash flows • NPV measures whether the investment is worth more than it costs
Cash Flow vs. Accounting Income • Discount actual cash flows • Using accounting income, rather than cash flow, could lead to erroneous decisions. Example A project costs $2,000 and is expected to last 2 years, producing cash income of $1,500 and $500 respectively. The cost of the project can be depreciated at $1,000 per year. Given a 10% required return, compare the NPV using cash flow to the NPV using accounting income.
Another Example Sales before Cash • Your salesperson sells a product for $500,000 in December but gives the customer 180 days to pay. • Accountants would treat this as an immediate change in Accounts Receivable (increasing accounts receivable now and reducing it in June when the customer pays). • Financial Analysts would treat this as 0 cash flow today but $500,000 cash inflow in June when the customer pays.
Incremental Cash Flows IMPORTANT Ask yourself this question Would the cash flow still exist if the project does not exist? • yes, do not include it in your analysis. • If no, include it.
Incremental Cash Flows • Discount incremental cash flows • Include All Indirect Effects • Forget Sunk Costs • Include Opportunity Costs • Recognize the Investment in Working Capital • Beware of Allocated Overhead Costs • Remember Shutdown Cash Flows
Inflation INFLATION RULE • Be consistent in how you handle inflation!! • Use nominal interest rates to discount nominal cash flows. • Use real interest rates to discount real cash flows. • You will get the same results, whether you use nominal or real figures
Inflation • Example You own a lease that will cost you $8,000 next year, increasing at 3% a year (the forecasted inflation rate) for 3 additional years (4 years total). If discount rates are 10% what is the present value cost of the lease?
Inflation • Example - nominal figures
Inflation • Example - real figures
Separation of Investment &Financing Decisions • When valuing a project, ignore how the project is financed. • Following the logic from incremental analysis ask yourself the following question: Is the project existence dependent on the financing? If no, you must separate financing and investment decisions.
Calculating Cash Flows • Think of cash flows as coming from three elements Total cash flow = + cash flows from capital investments + cash flows from changes in working capital + operating cash flows
Calculating Cash Flows • Cash Flow from Capital Investments • Almost every project requires some sort of initial investment. This is often capitalized from an accounting perspective. In finance, the investment represents a negative cash flow. • Changes in Working Capital • Investment in Raw Material Inventories.
Calculating Cash Flows • Operating Cash Flow • Operating cash flow = + Revenue - Costs - Taxes • Methods of Handling Depreciation • Method l: Dollars in Minus Dollars Out • Method 2: Adjusted Accounting Profits • Method 3: Add Back Depreciation Tax Shield
Blooper Industries • Initial Investment = $10,000 • Salvage Value = $2,000 • Initial Revenue = $15,000 • Initial Expense = $10,000 • Inflation Rate = 5% • Discount Rate = 12% • Tax Rate = 35%
Blooper Industries • Cash Flow from Operation ($ ,000s) Revenues 15,000 - Expenses 10,000 - Depreciation 2,000 = Profit before tax 3,000 - Tax (35%) 1,050 = Net Profit 1,950 + Depreciation 2.000 = CF from Operation 3.950
ICFI Project Analysis By : Else Fernanda, SE.Ak., M.Sc.
Topics Covered • How Firms Organize the Investment Process • Some “What If” Questions • Sensitivity Analysis • Scenario Analysis • Break Even Analysis
Capital Budgeting Process Capital Budget - The list of planned investment projects. The Decision Process 1. Develop and rank all investment projects = The Capital Budget 2. Authorize projects based on detailed proposals and backup information.
Capital Budgeting Process Capital Budgeting Problems • Ensuring that forecasts are consistent • Eliminating conflicts of interest • Reducing forecast bias • Selection criteria (NPV and others)
How To Handle Uncertainty Sensitivity Analysis - Analysis of the effects on project profitability of changes in sales, costs, etc. Scenario Analysis - Project analysis given a particular combination of assumptions. Simulation Analysis - Estimation of the probabilities of different possible outcomes. Break Even Analysis - Analysis of the level of sales at which the company breaks even.
Sensitivity Analysis Example • Given the expected cash flow forecasts listed on the next slide, determine the NPV of the project given changes in the cash flow components using an 8% cost of capital. Assume that all variables remain constant, except the one you are changing.
Scenario Analysis • Example – continued Cash Flows (years 1-12)
Break Even Analysis • Example Given the forecasted data on the next slide, determine the level of sales required of the company in order to break even, on an NPV basis. The company’s cost of capital is 10%.
Break Even Example in terms of Accounting • Sales: ? • Variable Costs: 81.25% of Sales • Fixed Costs: $2 million • Depreciation: $450,000 • To Break Even we need sales of: 2.45m / 0.1875 = $13.067 million You could then divide this by the price per unit to get the number of units you would need to sell to break even.
Break Even Example in terms of Finance • Investment: $5.4 million • Sales: ? • Variable Costs: 81.25% of sales • Fixed Costs: $2 million • Depreciation: $450,000 • Calculate: • Pretax Profit: (.1875 x Sales) - $2.45 million • Tax (at 40%): .40 x ((.1875 x Sales) - $2.45 million) • Profit after tax: .60 x (.1875 x Sales) - $2.45 million • Cash Flow: 450,000 + .60 x (.1875 x Sales) - $2.45 million = .1125 x Sales - $1.02 million
Break Even Example in terms of Finance • These cash flows will occur for 12 years • To Break Even we need sales that makes NPV = 0. • We need to set the present value of the cash flows = investment • Using the 12-year annuity factor (from a table or with a PV function) = 7.536 (PV of $1 a yr for each of 12 years with a discount rate of 8%): PV of Cash Flows = 7.536 x .1125 x Sales - $1.02 million Set this = $5.4 million (investment) … Sales = (5.4 + 7.69)/.8478 = $15.4 million … so Sales = $15.4 million
Operating Leverage • Operating Leverage- The degree to which costs are fixed. • Degree of Operating Leverage (DOL) - Percentage change in profits given a 1 percent change in sales.
Operating Leverage • Example - A company has sales outcomes that range from $16mil to $19 mil, depending on the economy. The same conditions can produce profits in the range from $550,000 to $1,112,000. What is the DOL?