Download
1 / 13
150 likes | 511 Vues
Dielectric. Z. Evanescent Field. Surface Plasmon. Metal. ≈ 50nm. Prism. θ i. θ r. θ i = θ sp. θ i = θ r θ i > θ c. Surface plasmon resonance sensing.

E N D
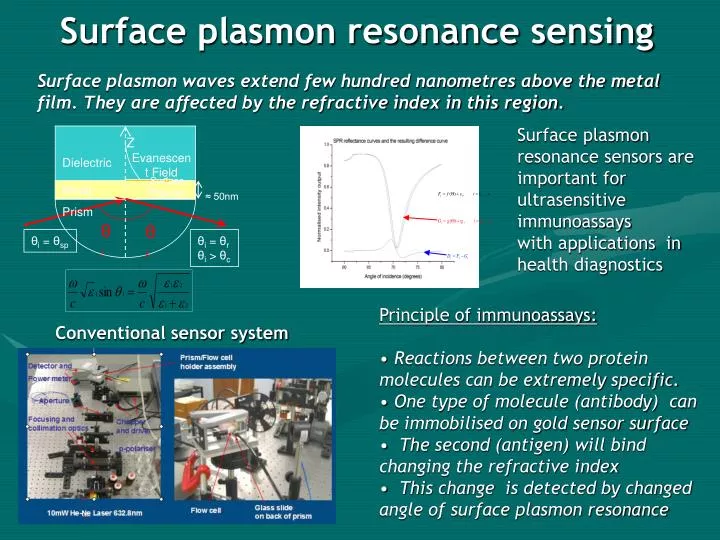
Dielectric Z Evanescent Field Surface Plasmon Metal ≈ 50nm Prism θi θr θi = θsp θi = θr θi> θc Surface plasmon resonance sensing Surface plasmon waves extend few hundred nanometres above the metal film. They are affected by the refractive index in this region. Surface plasmon resonance sensors are important for ultrasensitive immunoassays with applications in health diagnostics • Principle of immunoassays: • Reactions between two protein molecules can be extremely specific. • One type of molecule (antibody) can be immobilised on gold sensor surface • The second (antigen) will bind changing the refractive index • This change is detected by changed angle of surface plasmon resonance Conventional sensor system
p-polarised light To detector z Incident Reflected n (εn) zn-1 n-1 (εn-1) surface plasmon at interface, wavevector k|| j+1 (εj+1) zj j (εj) dj = zj – zj-1 zj-1 j-1 (εj-1) 2 (ε2) z1 1 (ε1) Transmitted x Simulation based on n-layer system • Simulation based on Fresnel reflectivity equations for an n-layered system • System consisted of a BK7 hemispherical prism, a 50nm gold layer and an analyte layer • Simulation produced R vs θ curves from system parameters (incident light wavelength λ and angle θ, layer thicknesses d and permittivities ε) Source: S. Orfanidis, “Electromagnetic waves and antennas” pp.81-108 R.U.S. Kurosawa et al, PRB 33,789 (1986)
Surface Plasmon Resonance Sensing System • Opportunities: • Surface plasmons probe ultrathin regions (monolayer is enough) • System can use inexpensive components, can run on Palm • Sample can be extremely small (microfluidics) • Challenges: • LED must be stable, preferably at a level 10-7 • Detector response must be linear, with similar accuracy • Readout must be very fast
Statistical hypothesis testing for sensitivity improvement • Two SPR curves Fi and Gi produce difference curve Di • From the average value of D and the variance S define a standardised Z value • Central Limit Theorem states that Z has approximately standard normal distribution • Hypothesis: that two curves Fi and Gi are the same • Choose to reject hypothesis for significance level =0.05: (Z>1.96) • Probability that this was wrong decision is less than 5%
Test parameters used • Input wavelength 632.8nm • 3 layered system (BK7 glass prism, 50nm gold layer, analyte layer of water and isopropanol solutions) • Collection device - array detector from Ames Photonics Inc. • 384 simulation points (3mm laser diameter over 1024 pixels contained in 7.99mm) • Noise standard deviation 3 x 10⁻⁶ (based on noise specifics for detector, total integration time of 100s with 1ms integration time) • Test applied to curve regions within front edge of reflectance curve
Nanotechnology approach for the optical sensing of trace pathogens Nanostructures increase device sensitivity • Aim: Develop a new optical based sensor technology for rapid detection of trace pathogens and chemicals in the environment. • Novel approach: Apply surface nano-patterning techniques to a Surface Plasmon Resonance (SPR) sensing system to achieve unprecedented sensitivity levels Surface plasmons are electromagnetic waves excited by light in metal films. Surface plasmons sense the analyte Sensor readout Examples of nanostructures
(a) 1. 2. 3. 4. (b) • EXAMPLES OF NANOMODIFIED SENSOR SETUPS • Nanomodification of SPR sensors is achieved through the binding of noble metal colloids near the sensor surface or through direct nanostructuring of the sensing surface via lithographic or direct writing processes. Examples of two nanomodified SPR setups are presented below. • Figure 2: Two nano-modified SPR sensor configurations reported in the literature: • 1. Prism for coupling to SP, 2. Thin metal layer(s), 3. Self Assembled Monolayer (typically 1,6-hexanedithiol or 2-mercaptoethylamine, 4. Attached metal colloids (typically Au or Ag, between 10 nm and 50 nm diameter) [11] • 1. Prism for coupling to SP, 2. Thin metal layer(s), 3. Metal nanowires formed usually by nanolithography, 4. Self Assembled Monolayer either on top of structure or between nanowires and thin metal layers [12] 1. 2. 3. 4. Rigorous coupled wave analysis for modelling nano-modified surface plasmon based sensing systems
OUTLINE OF MODEL: • RCW approach was developed by Moharam and Gaylord [20] and is a full vectorial solution of Maxwell's equations. • The approach is based on the following steps: • Representation of periodically varying permittivity (for example in a grating structure) using Fourier series expansion: • Simplification of Maxwell’s wave equations for incident light polarisation, through consideration of the orientation to the electromagnetic field with respect to the periodicity of the grating, using vector identities: • Equation * is simplified for p-polarised (transverse magnetic) light incidence as (from figure 1) H is perpendicular to so and • Using the vector identity and producing: • The electric or magnetic field within the grating is written using a space-harmonic representation: • 5. As the Fourier harmonics within the grating are a function of the grating perpendicular direction only, this allows the Maxwell equations within the grating to be written as a set of ordinary coupled differential equations with constant coefficients (in the case of a rectangular grating), allowing an eigenvalue approach to their solution. • From continuity considerations of the electromagnetic field at the boundary of the grating, the Fourier harmonics may be matched to the Rayleigh expansion of the fields beyond the grating region to determine the efficiency of each propagating order. • Boundary conditions for p-polarisation are:
θ θ Λ Reflectance results showing the effect of variation of nanowire period Λ. Insert: Diagram of setup under consideration. Reflectance results showing the effect of variation of nanowire width and height (W, H). Insert: Diagram of setup under consideration. Simulation results These simulations were carried out using DiffractMOD, an RCWA based software package from RSoft
514 nm R 101 In PVA 514 Notch Filter Gold Film Optical Fiber Surface plasmon coupled emission • Fluorescence emission is strongly directional • Applications for fluorescence bioassays
Evanescent SP Field SPCE Coupling Layer ~ 200 nm Silica Gold SP Wave SPR Excitation SPCE Cone Silica Protective Layer Sample Semitransparent Metallic Film Glass Slide TIRF Objective SPR SPR g SPCE SPCE Surface Plasmon Coupled Emission Excitation scheme adapted for microscopy Two photon SPCE demonstrated
Schematic diagram of a model bioassay Feasibility of bioassays in dense media
Relevant publications • “Plastic Versus Glass Support for an Immunoassay on Metal-Coated Surfaces in Optically Dense Samples Utilizing Directional Surface Plasmon-Coupled Emission Evgenia G. Matveeva, Ignacy Gryczynski, Joanna Malicka, Zygmunt Gryczynski, Ewa Goldys, Joseph Howe, Klaus W. Berndt, and Joseph R. Lakowicz, Journal of Fluorescence vol.15, no.6 : 865-71, Nov. 2005 • “Directional two-photon induced surface plasmon-coupled emission” Gryczynski, Ignacy; Malicka, Joanna; Lakowicz, Joseph R.; Goldys, Ewa M.; Calander, Nils; Gryczynski, Zygmunt, Thin Solid Films, 491(1-2), 173-176, (2005). • “Ultrasensitive detection in optically dense physiological media: applications to fast reliable biological assays” . Matveeva, Evgenia G.; Gryczynski, Ignacy; Berndt, Klaus W.; Lakowicz, Joseph R.; Goldys, Ewa; Gryczynski, Zygmunt. Proceedings of SPIE-The International Society for Optical Engineering (2006), 6092 125-133. • “Detection limit improvement of surface plasmon resonance based biosensors using statistical hypothesis testing”, Barnett, Anne; Goldys, Ewa M.; Dybek, Konrad, Proceedings of SPIE-The International Society for Optical Engineering (2005), 5703(Plasmonics in Biology and Medicine II), 71-78. “Strategies for noise reduction and sensitivity increase for a Surface Plasmon Resonance (SPR) based biosensing system”, A. Barnett, E.M. Goldys, K. Dybek. OWLS Conference, Optics Within Life Sciences” Melbourne 28 Nov 2004 – 1 Dec 2004