Download
1 / 13
130 likes | 209 Vues
Warm Up Use the Distance Formula to find the distance, to the nearest tenth, between each pair of points. 1. A (6, 2) and D (–3, –2) 2. C (4, 5) and D (0, 2) 3. V (8, 1) and W (3, 6). 9.8. 5. 7.1. 4. Fill in the table of values for the equation y = x – 14. 11-7.

E N D
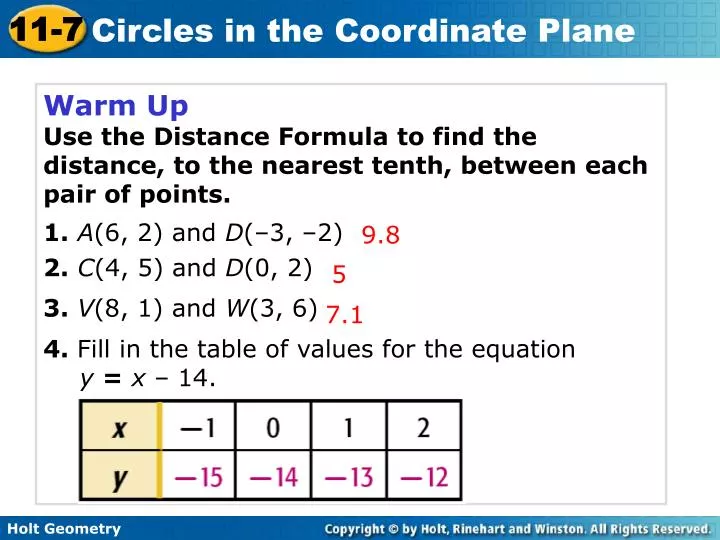
Warm Up Use the Distance Formula to find the distance, to the nearest tenth, between each pair of points. 1.A(6, 2) and D(–3, –2) 2.C(4, 5) and D(0, 2) 3.V(8, 1) and W(3, 6) 9.8 5 7.1 4. Fill in the table of values for the equation y = x –14.
11-7 Circles in the Coordinate Plane Holt Geometry
Example 1A: Writing the Equation of a Circle Write the equation of each circle. J with center J (2, 2) and radius 4 (x – h)2 + (y – k)2 = r2 Equation of a circle Substitute 2 for h, 2 for k, and 4 for r. (x – 2)2 + (y – 2)2 = 42 (x – 2)2 + (y – 2)2 = 16 Simplify.
Example 1B: Writing the Equation of a Circle Write the equation of each circle. K that passes through J(6, 4) and has center K(1, –8) Distance formula. Simplify. Substitute 1 for h, –8 for k, and 13 for r. (x – 1)2 + (y – (–8))2 = 132 (x – 1)2 + (y + 8)2 = 169 Simplify.
Since the radius is , or 4, use ±4 and use the values between for x-values. Example 2A: Graphing a Circle Graph x2 + y2 = 16. Step 1 Make a table of values. Step 2 Plot the points and connect them to form a circle.
(3, –4) Example 2B: Graphing a Circle Graph (x – 3)2 + (y + 4)2 = 9. The equation of the given circle can be written as (x – 3)2 + (y –(–4))2 = 32. So h = 3, k = –4, and r = 3. The center is (3, –4) and the radius is 3. Plot the point (3, –4). Then graph a circle having this center and radius 3.
Since the radius is , or 3, use ±3 and use the values between for x-values. Check It Out! Example 2a Graph x² + y² = 9. Step 2 Plot the points and connect them to form a circle.
(3, –2) Check It Out! Example 2b Graph (x – 3)2 + (y + 2)2 = 4. The equation of the given circle can be written as (x – 3)2 + (y –(–2))2 = 22. So h = 3, k = –2, and r = 2. The center is (3, –2) and the radius is 2. Plot the point (3, –2). Then graph a circle having this center and radius 2.
Lesson Quiz: Part I Write the equation of each circle. 1.L with center L (–5, –6) and radius 9 (x + 5)2 + (y + 6)2 = 81 2. D that passes through (–2, –1) and has center D(2, –4) (x – 2)2 + (y + 4)2 = 25
Lesson Quiz: Part II Graph each equation. 3.x2+ y2= 4 4. (x – 2)2 + (y + 4)2= 16
Lesson Quiz: Part III 5. A carpenter is planning to build a circular gazebo that requires the center of the structure to be equidistant from three support columns located at E(–2, –4), F(–2, 6), and G(10, 2). What are the coordinates for the location of the center of the gazebo? (3, 1)