Download
1 / 1
20 likes | 209 Vues
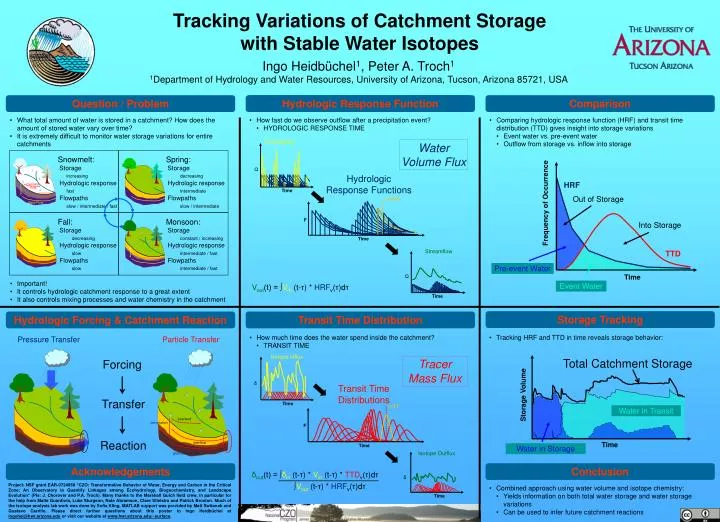
overland. δ. percolation. Time. interflow. groundwater flow. Tracking Variations of Catchment Storage with Stable Water Isotopes.

E N D
overland δ percolation Time interflow groundwater flow Tracking Variations of Catchment Storage with Stable Water Isotopes Ingo Heidbüchel1, Peter A. Troch11Department of Hydrology and Water Resources, University of Arizona, Tucson, Arizona 85721, USA Question / Problem Hydrologic Response Function Tracking of Varying Mean Transit Time Comparison • What total amount of water is stored in a catchment? How does the amount of stored water vary over time? • It is extremely difficult to monitor water storage variations for entire catchments • How fast do we observe outflow after a precipitation event? • HYDROLOGIC RESPONSE TIME • Comparing hydrologic response function (HRF) and transit time distribution (TTD) gives insight into storage variations • Event water vs. pre-event water • Outflow from storage vs. inflow into storage Hydrologic Response Functions Water Volume Flux Snowmelt: Storage increasing Hydrologic response fast Flowpaths slow / intermediate / fast Spring: Storage decreasing Hydrologic response intermediate Flowpaths slow / intermediate mHRT Precipitation Streamflow HRF Overland Flow F Q Q Interflow Out of Storage Frequency of Occurrence Base Flow Time Time Time Fall: Storage decreasing Hydrologic response slow Flowpaths slow Monsoon: Storage constant / increasing Hydrologic response intermediate / fast Flowpaths intermediate / fast Into Storage δ Time TTD Pre-event Water Time • Important! • It controls hydrologic catchment response to a great extent • It also controls mixing processes and water chemistry in the catchment Event Water Vout(t) = ∫Vin (t-τ) * HRFv(τ)dτ Storage Tracking Hydrologic Forcing & Catchment Reaction Transit Time Distribution • How much time does the water spend inside the catchment? • TRANSIT TIME • Tracking HRF and TTD in time reveals storage behavior: Pressure Transfer Particle Transfer Total Catchment Storage Isotope Influx Tracer Mass Flux Forcing Transit Time Distributions Storage Volume Transfer Water in Transit mTT F Reaction Time Water in Storage Time Isotope Outflux δout(t) = ∫δin(t-τ) * Vin (t-τ) * TTDv(τ)dτ ∫Vout (t-τ) * HRFv(τ)dτ Acknowledgements Conclusion Project: NSF grant EAR-0724958 “CZO: Transformative Behavior of Water, Energy and Carbon in the Critical Zone: An Observatory to Quantify Linkages among Ecohydrology, Biogeochemistry, and Landscape Evolution” (PIs: J. Chorover and P.A. Troch). Many thanks to the Marshall Gulch field crew, in particular for the help from MaiteGuardiola, Luke Sturgeon, Nate Abramson, Clare Stielstra and Patrick Broxton. Much of the isotope analysis lab work was done by Sofia Kling. MATLAB support was provided by Matt Switanek and Gustavo Carrillo. Please direct further questions about this poster to Ingo Heidbüchel at ingohei@hwr.arizona.edu or visit our website at www.hwr.arizona.edu/~surface. • Combined approach using water volume and isotope chemistry: • Yields information on both total water storage and water storage variations • Can be used to infer future catchment reactions