Download
1 / 31
310 likes | 477 Vues
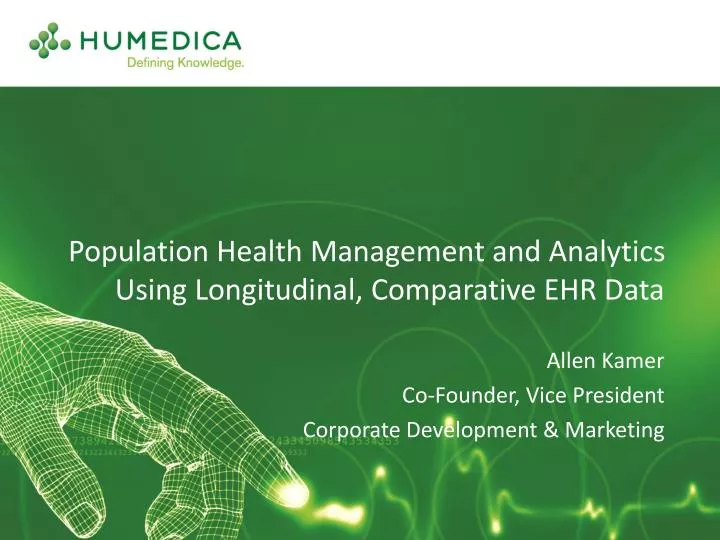
Population Health Management and Analytics Using Longitudinal, Comparative EHR Data. Allen Kamer Co-Founder, Vice President Corporate Development & Marketing. Humedica Vision. Transform disparate clinical data into the most actionable real-world insights to empower confident decision-making.

E N D
Population Health Management and Analytics Using Longitudinal, Comparative EHR Data Allen Kamer Co-Founder, Vice President Corporate Development & Marketing
Humedica Vision • Transform disparate clinical data into the most actionable real-world insights to empower confident decision-making
The Writing is on the Wall Source: “The View from Healthcare’s Front Lines: An Oliver Wyman CEO Survey”
Context • Most Significant Change Since Medicare & DRGs • Pundits Predict Doom (We have already failed once at this - Capitation) • Providers Will Assume Enormous Risk
What’s Different This Time? • Learned Lessons from Capitation • We can’t just cut utilization • We may need to trade some resources - e.g. more ambulatory care toe reduce ED use • We have to maximize Cost-Benefit Equation or we face another consumer revolt • Risk = Unknown • EMR’s provide far better data than the claims based sources we had last time • Key is to leverage those clinical data alongside claims data
The Opportunities for Shared Savings are Specific & Well Understood Shared Savings $ • The…most promising areas for reducing Medicare costs in the near term, based on hard evidence, are efforts to • reduce the need for hospitalizations among beneficiaries with the most serious chronic illnesses • reduce hospital readmissions rates • reduce disparities across physicians and geographic areas in care delivery, utilization, and expenditures. Time
Quality Measures Aren’t Enough • But Can’t We Simply Track the ACO Quality Measures? • ACO Measures for CHF: • #10 = # Discharges • #31 = Beta Blockers for LVSD • How will these two measures help you prevent CHF Hospitalizations& Readmissions?
Succeeding in the Era of Healthcare Reform Lower Costs, Higher Margins Improve Quality of Patient Care PROACTIVELY MANAGE PATIENT POPULATIONS IMPROVE PROVIDER PERFORMANCE OPTIMIZE VALUE EQUATION = QUALITY/COST IDENTIFY AND ENSURE BEST PRACTICES IMPLEMENT CHANGE, MEASURE /DEMONSTRATE IMPACT Longitudinal Patient-Centered Applications with Comparative Analytics Clinical Data Financial Data Operational Data Inpatient Care Ambulatory Care
Humedica’s Innovations • Aggregate Data Across the Continuum • Clean, Normalize & Validate the Data • Transform Data Into Insight • Make Insights Actionable
Turning raw material into finished goods – beware of the potential to get burned
And Terminology is Only Part of It These are typical unit designations for a WBC (Similar to “Weight in Pounds) These unit designations are unintelligible and need to be examined forensically & then mapped Also, the number of different “normal ranges” for a single test have to be mapped individually to report across the population
Longitudinal Patient Records Patient Encounter • Complaints • Symptoms • Diagnosis • Vital Signs • Physician Notes • Lab & Radiology Reports Ambulatory Hospital-Based Treatment triggers, therapeutic choices and associated outcomes Pharmacy Radiology Patient History ED Lab • Demographics • Co-morbidities • Family History • Medication History • Payer/ Formulary Information
What Are We Missing When We Only Look at Claims Data? Taken from a subset of groups
Opportunity Dashboard: DM Provider Performance
Interactive Collaborative Process – Shared Learning to Drive Improved Outcomes • Findings on Anceta wiki(Anceta to assist withdocumentation) • Further research,publication • Prioritize follow-upquestions • Opportunity analysesby Anceta • Your data explorationusing MinedShare • Your experience andintuition Collaboration Share Best Practices Generate Hypotheses Data Learning Information Care Process Performance Drivers Outcomes Cost Compare Improvements DesignInterventions Comparative Data Action Knowledge • Implement interventions(local priorities/readiness) • Track impact using MinedShare • Periodic check-in with collaborators(bi-monthly webinars, listserve) • In-person meetings q 6 months or so • Experience of colleagues • Collaborative discussion • Collaborative data exploration
Monitor and Track Patient Health Outcomes; Evaluate Performance as Compared to Benchmark Diabetes Dashboard: Risk, Outcomes • Light gray box: the range of the group averages across the groups for a given metric (the “whisker”) • Dark gray box: the range of the 25th to 75th percentile of group averages for a given metric (the “box”) • Vertical black line: the median group average for a given metric • Dot (red triangle, black square, green circle): your group’s result for the metric
Patient-Level Data Identifies Gaps in Careand Highlights Opportunities to Manage Risk • 197 patients identified with A1c > 9, on 3+ DM medications, but NOT on insulin Which Patients Are At Risk? Which PCPs are Treating Them?
Diabetes Case Study: Productivity and Clinical Improvements 292 FTE Physicians Diabetic-centered patient identification program launched using clinical data High-Risk Diabetes cohort created Results: >5000 patients identified using Humedica MinedShare 1800 visits scheduled via Care Coordinators 90% of scheduled patients made their appointments $500,000 of new revenue identified by Group Measured year-over-year improvement for the following: 28.9% improvement for LDL 17.6% improvement for A1c 30% improvement for BP
Code Improvement:Importance of Baseline Coding • CMS plans to risk-adjust beneficiaries in ACOs to ensure that ACOs are not simply selecting the healthiest patients • CMS will use its Hierarchical Category Coding (HCC) mechanism developed to reimburse capitated Medicare Managed Care Plans • To prevent physicians from upcoding or favoring less sick patients, CMS will only adjust a continuously-enrolled member’s health status if the score declines. Accurate baseline coding enables providers to receive full reimbursement
ACO Coding: Forfeited Savings • If the patient is not coded for COPD during the predicted period, the actual risk adjusted $PMPM for this patient is $831.22 vs. the expected risk adjusted $PMPM of $621.83
Powerful Predictive Analytics Drive Actionable Insights Example: Congestive Heart Failure Correlate Risk with Costs Identify Pts at Risk Correlate Pt Risk by MD Evaluate CHF Utilization Rates Compare Physician Performance
CHF Case Study: Implementing Predictive Analytics to Optimize Interventions for High-Risk Patients Using Humedica’s CHF predictive model to broaden view of CHF patients who may benefit from outreach Criteria for inclusion have expanded to include patients with no past hospital utilization Protocols created/modified in PCMH setting to bring in patients for more intense ambulatory care
Hypertension Case Study: Productivity and Clinical Improvements Developed a scalable process for identifying and tracking patients with hypertension Operational gains estimated at 25-30% savings in time per month to analyze the hypertension population Provide hypertension control reports to individual practices and physicians Facile quantification of improved clinical outcomes
What to Focus on First? • PCMH/High Risk Patient Management • Track high risk poly-chronic patients • Identify actionable clinical opportunities for care coordinators • Intervene with patients at highest risk for preventable admissions • Physician Scorecards • Quickly evaluate physician performance in process and outcomes of care • Analysis of Prescribing Patterns • Identify drug prescribing patterns vis-à-vis clinical outcomes • Track compliance against medication protocols • Opportunity Assessment • Identify high utilizers and care transition opportunities • Evaluate resource utilization against clinical outcomes • Track impact of care redesign • Code Improvement • Identify gaps in coding • Identify uncoded patients that belong to different disease cohorts who are at risk • Cohort Analytics • Identify clinical, demographic, and risk profiles of different disease cohorts • Gaps in Care • Identify patients who are not receiving standard care by site of care and provider
Scorecard for Success • Integrate, Clean and Present All Necessary Data with Minimal IT Burden • Reveal and Predict the True Risks in My Population • Help Me to Optimize Payments by Improving my Risk Scores • Help Me Close Gaps in Care & Optimize my Performance on Measures • Empower Me to Optimize my Physician Network • Help Me Ensure Best Practices • Help Me Identify Higher Than Expected Costs/Resource Utilization • Help Me Prove the Clinical & Financial Value of the Care We Deliver to our Key Stakeholders • Empower Me to Optimize Contracts with Payers