Download

1 / 28
290 likes | 470 Vues
Simulation in Digital Communication. chapter # 6 Digital Transmission Through Bandlimited Channels. 6.2 - The power Spectrum of a Digital PAM Signal. A digtal PAM signal at the input to a communication channl. reciprocal of the symbol rate. pulse waveform.

E N D
Simulation in Digital Communication
chapter # 6 Digital Transmission Through Bandlimited Channels
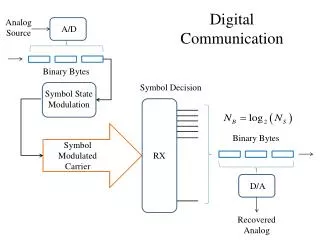
6.2 - The power Spectrum of a Digital PAM Signal A digtal PAM signal at the input to a communication channl reciprocal of the symbol rate pulse waveform scale factor (where 2d is the “Euclidean distance”)
to determine the spectral characteristics of the random process V(t), we must evaluate the power spectrum. 1)mean value 2)autocorrelation function
The power spectrum of V(t) is the Fourier transform of the average autocorrelation function. The power spectrum of amplitude sequence an
Problem 6.1 Answer ip_06_01 Determine the power spectrum of V(t) when {an} is an uncorrelated sequence and g(t) is the following rectangular pulse.
Problem 6.2 Answer ip_06_02 Suppose the autocorrelation function of the sequence {an} is and g(t) is the rectangular pulse.shown at the previous problem. Evaluate Sv(f) in this case.
SOLUTION The power spectrum of the PAM signal was given by from and using also the data we can replace...
6.3 - Characterization of bandlimited channels and channels distortion We can characterize many communication channels as bandlimited linear filters, described by their frequency response phase response Amplitude response
we can also express it as an envelope delay (group delay) :
nondistorting (ideal) channel Amplitude response -constant phase response - linear function of frequncy (envelope delay -constant) distorting channel Amplitude distortion - Amplitude response isn’tconstant delaydistortion- envelope delayisn’tconstant)
Effect of channel distortion channel input channel output equalizer
Average amplitude and delay characteristics of a medium-range telephone channel,
Impulse response of the average channel with amplitude and delay shown before
Problem 6.3 Answer ip_06_03 T.B.D
Impulse response Frequency response of linear phase FIR filter
Problem 6.4 Window method if the desired channel response is C(f) for |f|<W and C(f)=0 for |f|>W then Impulse response for example: if channel is ideal, then C(f)=1, |f|<W and hence
Answer ip_06_04 Let us design an FIR filter with: W=2000 Hz and Fs =1/Ts=10KHZ. (this digital filter may be implemented by sampling h(t) at t=nTs, where Ts is the sampling interval and n = 0,+/-1,+/-2,...)
Problem 6.5 The impulse response of a two-path(multipath) radio channel can expressed as: random processes the delay between 2 paths
Answer ip_06_05 simulate such a channel on the computer