Download
1 / 59
590 likes | 715 Vues
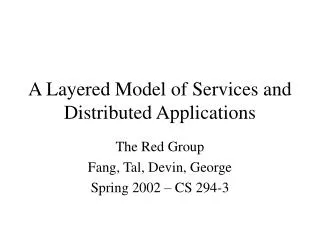
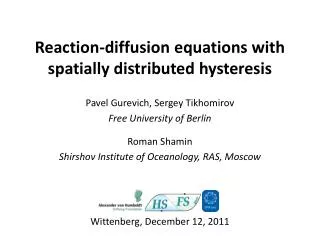
GEO. PEARL. A spatially-distributed model of pesticide leaching Aaldrik Tiktak. http://www.pearl.alterra.nl. GEO. PEARL. Outline of presentation Why spatially distributed modelling? What is GeoPEARL? How is a GeoPEARL assessment carried out? Which are the main model outputs?

E N D
GEO PEARL A spatially-distributed model ofpesticide leaching Aaldrik Tiktak http://www.pearl.alterra.nl
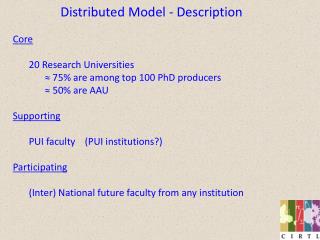
GEO PEARL • Outline of presentation • Why spatially distributed modelling? • What is GeoPEARL? • How is a GeoPEARL assessment carried out? • Which are the main model outputs? • Selected Results and Examples • Questions? • Overview of the User Interface
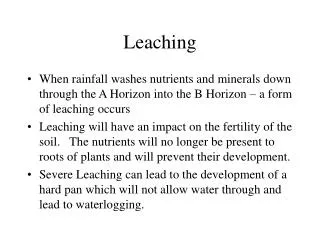
Leaching in the area of use Leaching in drinking water abstraction areas • Why spatially distributed modelling in registration? • Explicit consideration of the variability of the leaching process: • where are the vulnerable regions? • Are specific areas (e.g. drinking water abstraction areas) sufficiently protected?
Position of the Dutch Standard Scenario Why spatially distributed modelling in registration? • Explicit calculation of ‘realistic worst-case conditions’: • calculation of percentiles of the leaching concentration in space • more realistic choice of standard scenario’s, no need for safety factors in registration
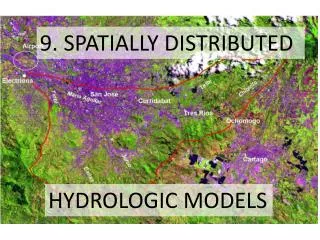
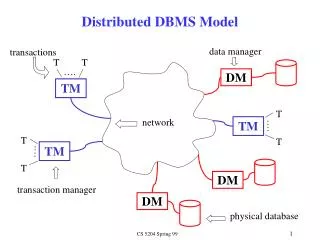
What is GeoPEARL? • GeoPEARL is a spatially-distributed model of pesticide leaching to the groundwater and surface waters in the Netherlands. The core of the GeoPEARL consists of PEARL itself.
PEARL 1D column field-ditches water courses< 3m water courses> 3 m Groundwater table Drainage into local surface waters Leaching into the regional groundwater Position of column in landscape
The plot appraoch • PEARL is run in a GIS context for a large number of unique combinations (plots) of soil, climate, land-use and hydrogeological units.
Obtaining the lower boundary of SWAP: • Lower boundary condition is a prescribed flux condition (so-called ‘Neumann condition’); • Lower boundary of SWAP is upper boundary of National Groundwater Model; • Start with NAGROM and a simple unsaturated zone model; • Adjust the boundary flux by running NAGROM and SWAP iteratively; • Wait until convergence is reached.
Slightly acidic sandy soils (‘higher part’) Clay soils with near neutral pH-values (‘lower part’) Acidic peat soils Basic soil properties in GeoPEARL pH-KCl!!!!!
How are GeoPEARL assessments carried out? • GeoPEARL is run for 250-6405 plots, depending on spatial detail wanted; • The model is run for the area of potential usage only. This area is assumed equivalent to the area of the crop(s) for which a registration is requested; • For each plot and crop-type, the model is run for 26, 46 or 66 years (FOCUS procedure); • For each plot the median leaching concentration in time is extracted and put into a map.
To be specified by the user: • Substance properties (start withstandard dossier) • Application schedule • Number of plots (i.e. spatial detail wanted) • One or more crops for which a registration is requested
More attention for relationship between soil properties and substance properties: • DT50 in top-soil specified as a function of clay content, pH and organic matter content • KFspecified as a function of organic matter and pH: or as a function of other properties:
More attention for relationship between soil properties and substance properties:
The target variable produced by the model: • The 90th percentile in space and the 50th percentile in time of the leaching concentration at 1 m depth at the area of (potential) usage
Further model outputs: • Maps and frequency diagrams of terms of the water balances • Maps and frequency diagrams of terms of the substance balances, including the leaching, drainage and volatilisation fluxes • Maps of percentiles and frequency diagrams of the leaching concentration in time • Tables of balance terms
High pH Vulnerable sandy soils Opposite spatial patterns! Example 1: Comparison of leaching of two substances Ordinary substance pH-dependent sorption
Drainage fluxes are highest in clay and peat soils... Leaching fluxes are highest in sandy soils... Example 2: Comparison of drainage and leaching
Some conclusions from previous examples: • Drainage fluxes are generally higher than leaching fluxes. • For ordinary substances, drainage dominates in the peat and clay soils and leaching in sandy soils. • The leaching pattern can be quite different for non-ordinary substances (e.g. substances with pH-dependent sorption)
GeoPEARL considers the area of potential usage: • Pesticides are usually authorised for particular crops; • The new decision tree therefore considers the area of potential usage, approximated by the area of crops for which a registration is requested • GeoPEARL is distributed with a database of areas for 24 major crops • All results are presented for the area of potential usage
GeoPEARL crops are not hydrologically different • During the derivation of the UC’s, only four crops were included (grass, mais, potatoes and forest); • For each plot, the dominant crop is used. Hydrological parameters are assigned to these crops; • The 24 GeoPEARL crops are used for pre-processing only; i.e. for calculating the area of use.
Maize is grown on slightly acidic sandy soils Potatoes are grownon light sandy claysoils and in ‘the Veenkolonien’ Effect of area of use on pesticide authorisation (1)
Slightly acidic sandy soils Light sandy claysoils and ‘the Veenkolonien’ Effect of area of use on pesticide authorisation (2) Substance with pH-dependent sorption behaviour
Effect of area of usage on authorisation (cntd.) Unsafe in potatoes Safe in maize
Some conclusions from previous section: • GeoPEARL explicitly considers the variation of the leaching process, so that it is now possible to evaluate the leaching for different crop types • Consideration of the area of usage can have a strong effect on the authorisation decision • It is extremely important to investigate the relationship between pesticide properties and soil properties
GeoPEARL assessments versus assessment items • A notifier may wish to register for several crops; • For each crop, GeoPEARL must be run separately; • Combination of crop and application scheme is an assessment item; • The three items together form an assessment; • The 90th percentile is calculated for the combination of the three crops, i.e. for the assessment.
Reduction of computation time by using zones: • To reduce the computation time, plots are taken together; • Clusters of plots are called ‘zones’.
Slicing is done on the basis of ‘vulnerability’ • The normal Arc/Info slice operation clusters neighbouring cells; • We cluster plots with adjacent vulnerability indexes; • This will give a more reliable estimation of the 90th percentile, because we sample in each class of the cumulative frequency distribution.
these two aredifferent! almost nodifference How many plots must be included in an assessment?
How many plots must be included in an assessment? (cntnd.) More plots = more detail, but 250 plots is generally enough...
250 versus 6405 plots spring autumn 250 plots is generally enough...
Some conclusions from previous section: • The maximum number of zones is 6405 (which is equal to the number of plots); • A first impression of the leaching pattern can be obtained with less plots (e.g. the 30 as used in this course); • At least 250 plots are required for an accurate estimation of the 90th percentile. This is the minimum number for a final submission.
Other uses of GeoPEARL • GeoPEARL has been combined with a database on pesticide usage in order to calculate the actual pesticide loads into surface waters and groundwaters. • Evaluation of policy plans... • A European version of GeoPEARL (called EuroPEARL) has been developed • EU registration in zones...
High leaching risk EuroPEARL example: 80th percentile of the leaching concentration of FOCUS substance D Hotspots occur everywhere in Europe
Catchment EU Possible scales…
Final remarks • A model is now available that can be used to assess the leaching into the groundwater and the drainage into surface waters at a regional-scale • The model is operational for: • the Dutch registration procedure • evaluation of policy plans
To be specified by the user: • Substance properties (start withstandard dossier) • Application schedule • Number of plots (i.e. spatial detail wanted) • One or more crops for which a registration is requested
GUI step 5: Run wizard, select crops and applications (i.e. add items)