Download

1 / 31
1.5k likes | 3.35k Vues
Sonar. Chapter 9. History. Sound Navigation And Ranging (SONAR) developed during WW II Sound pulses emitted reflected off metal objects with characteristic ping Like radar and lidar time of flight is measured to determine distance Early sonar gave only distance and direction to target

E N D
Sonar Chapter 9
History • Sound Navigation And Ranging (SONAR) developed during WW II • Sound pulses emitted reflected off metal objects with characteristic ping • Like radar and lidar time of flight is measured to determine distance • Early sonar gave only distance and direction to target • Modern sonar used for mapping
History • GIS-compatible bathymetric data now available for many regions • Used for geologic mapping of seafloor • Search and recovery operations • Environmental monitoring
Principles of SONAR • Sound waves are a mechanical vibration • Can only travel through an elastic medium (air, water, earth) • Measured by frequency instead of wavelength (λ) • How is frequency related to λ?
Principles • f = vw / λ • Vw is thespeed and f is frequency • Usually give as cycles/second or hertz (Hz) • Human hearing in the rage of 20 – 20,000 Hz • Sound waves are much slower than EM radiation • In water, sound travels about 1,500 m/s • Speed of light is about 3 x 10⁸ m/s
Principles • Ultrasound is used in medicine and sometimes in engineering • Uses frequencies of 1-15 MHz
Principles • In environmental work there are three kinds of sonar • Side-scan • Usually in the range of 100 kHz - 400 kHz • Single beam • Usually at 12 kHz - 200 kHz • Multibeam – to 6,000 m deep • Usually at 12 kHz - 200 kHz • Lower frequency = longer range and reduced spatial resolution
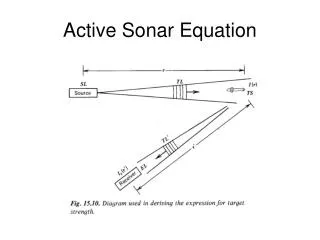
Side-Scan Sonar • Has been used to detect objects and map bottom characteristics • Shows size, shape and texture of features • Can determine length, width and height • The sonar is usually mounted on a sled or towfish and dragged close to the bottom • About 10% of the maximum acoustic range • Low angle to emphasize surface relief
Image swaths about 100-500 m wide • Usually do 200% coverage to eliminate gaps • Especially the track underneath the vessel since that is not imaged • Far field image is degraded
Side Scan • Strong returns are brighter • Influenced by slope and surface roughness • Smooth surface is darker • Objects sticking up will create shadows much like radar
Acoustic Lens Sonar • Provides high resolution at close range in turbid water • Developed in the 1990s • Frequencies between 1-2 MHz • Range of 1-30 m • Uses plastic lenses instead of electronics to focus the beams onto a linear array of acoustic transducers (like imaging scanners) • Produces the image
Acoustic beamforming modifies the propagation of sound by introducing spatially dependent delays into a wavefront. • This focuses incoming sound from a single source or direction into a small volume of space so that it can be detected by a single transducer. • Acoustic beamforming can be implemented using electronic circuitry or an acoustic lens
Acoustic Lens Sonar • Used to produce video at a rate of 6-20 frames per second • Used primarily by military to see in dark
Single Beam Sonar • Used primarily for mapping channels and for engineering applications • Uses only a single source • Does not produce much data, because only a single point for each pulse under the tramsducer
Acoustic data points collected along intertwining transects in Rehoboth Bay, Delaware. The points are classified as algae (green) or no algae (light blue). The points were processed and used to derive a coarse map of the algae distribution (dark green squares).
Multibeam Sonar • Sensor uses an array of sources and receivers • Energy focused on a narrow strip beneath the ship • Multiple echoes give a profile of depths along a strip perpendicular to ship track • Swath width depends on depth • Usually 2-4x water depth
Multibeam Sonar • Crater Lake flyby