Download
1 / 21
210 likes | 319 Vues
CHALLENGES IN INDIAN ECONOMY: DYNAMICS OF CURRENCY FLUCTATIONS AND CURRENT ACCOUNT DEFICITS . PRANAB BANERJI PROFESSOR, INDIAN INSTITUTE OF PUBLIC ADMINSITRATION. CURRENT UNCERTAINITY. Is the current economic situation bleak enough for comparison with 1990-91?

E N D
CHALLENGES IN INDIAN ECONOMY: DYNAMICS OF CURRENCY FLUCTATIONS AND CURRENT ACCOUNT DEFICITS PRANAB BANERJI PROFESSOR, INDIAN INSTITUTE OF PUBLIC ADMINSITRATION
CURRENT UNCERTAINITY • Is the current economic situation bleak enough for comparison with 1990-91? • Between 2003-08, Indian economy grew at 8-10 percent, prompting prognostications of India’s emergence as an economic super power. • From ‘India Unbound’ to ‘The Caged Phoenix’.
GROWTH TRENDS • World Recession 2008 onwards. • India maintains high growth upto 2011. • Huge stimulus package (`1.86 trillion). • Monetary easing (Mo:21.5percent 2010-11). • Growth rates fall from 9.3 percent (2010-11) to about 5 percent (2012-13). • Declining trend possible current fiscal
SECTORAL GROWTH • Recent slowdown across sectors • Industrial slowdown • Even services sector shows decline: an unprecedented development? • Decline in Domestic Saving Rate (from approx 37 in 2007-08 to 31 percent in 2011-12).
STIMULUS PHASE • Growth rates maintained, but a cost. • Fiscal Deficit 2008-09: Actual double of target (3%) 2009-10:6.5 percent. • M3 growth 2007-09: about 20%/yr. • Export Growth: 29, 13.6 and -3.5 (2007-10). • Current A/c Balance: -1.3, -2.3 and -2.8 (2007-10). • Inflation (CPI): 6.2, 9.1 and 12.4 (2007-10).
THEREAFTER • Fiscal Deficit: 5.7 and 5 (2011-13) (Lower than budget estimate) • Central Govt expenditure: 15.8 percent of GDP (2009-10) to 13.1 percent (2012-13). • M3 growth rates: 15.6 and 11.2 (2011-13). • Mo growth rates: 21.5 (2010-11) to 4.3 (Q3 growth 2012-13). • GDP growth rates: 6.2 and 5 percent.
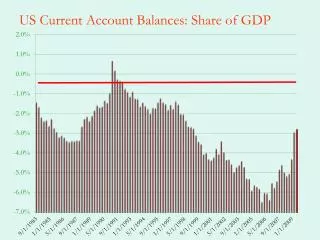
EMERGING PARADOXES • Despite Demand Compression, current account deficit widens. • In 2011-12 exports also grow by 21.3 percent, growth slows to 6.2 percent, yet CAD is -4.2 percent. • Rises to -4.8 percent and the Trade Balance crosses 10 percent (2011-13). • Inflation persists: 8.4 and 10 (2011-13).
POLICY PARADOX • In 2012-13, all elements constituting aggregate demand slackened. • PFCE growth halved: 8 percent to 4.1 percent. • Exports growth: 21.3 (2011-12) to -4.9 (2012-13). • Gross Fixed Capital Formation: 4.4 to 1.7 percent growth during the years. • Government Final Consumption Expenditure: 8.6 to 3.9 • When Aggregate Demand was slackening why was policy not counter-cyclical? • Revenue Receipts Stagnant: effect accentuates.
MANAGING CAD • Stagnancy in capital account inflows • After a peak in 2007-08 of $ 106.6b, inflows reduced to $ 7.2 b the next year. • Thereafter, it crossed $ 60b since 2010-11. • Reserve have fallen from peak $ 305b (2010-11) to $ 296 b (Dec. 2012), $ 275b (Sept. 2013). • Sustainable CAD- 2.3% GDP (Rangarajan & Mishra). Assumes Net Capital Inflows $ 50-70b annually over next 5 yrs. • Should be reduced to -2 percent ( R & M)
Exchange Rate • Sharp Rupee (vs $) depreciation: ` 44.2 (July, 2011), ` 55.8 (July, 2012) ` 68 (Aug. 2013). • NEER depreciation less. • REER depreciation even less, if at all. • Volatility has sharply increased. • RBI monetary policy occasionally secondary to exchange-rate policy.
EXCHANGE RATE POLICY EFFECTIVENESS • Indi’s Exchange Rate Policy: Reduced Volatility and checking REER appreciation. • Limits to the policy: sharp nominal exchange rate fluctuations, inflation, persistent and increasing CAD. • Responsiveness of Exports to Exchange Rate: (-) 0.66 (Aziz & Chenoy 2012, insignificant) (-) 0.2 (L), -0.1 (s) (IMF, 2012). (-) 0.5 (Rangarajan & Patra 2013, insignificant) • Responsiveness of Imports to Exchange Rate: 0.47 (Datta, 2004) 0.1 for net POL imports, insignificant for non-POL (RBI, 2012) -contd-
-contd- • “Estimates…show that changes in both overall trade balance as also in the non-oil trade balance are statistically insignificant to REER movements”. (RBI, 2012).
REASONS FOR PERSISTENT CAD • Forty percent of imports: Energy & Fertilizers • Over ten percent: Gold & Silver • POL & Fertilizers import bill together almost equal the trade deficit. • Price elasticity of imports low. • Exchange rate pass throughimperfect. • According to Moody’s, fuel subsidies `1.6 lakhcrore (2012-13) or 60 percent of revenue account deficit. • Gold as safe inflation-hedge.