Download
1 / 7
70 likes | 238 Vues
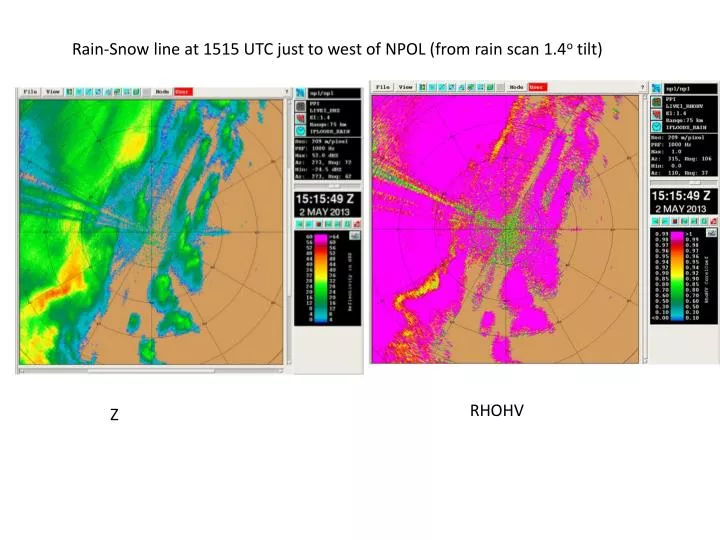
Rain-Snow line at 1515 UTC just to west of NPOL (from rain scan 1.4 o tilt). RHOHV. Z. Surface Metars 1843 UTC (we are in snow; located at the dot) (note the sustained winds as well; 20-25 kts was typical with gusts above 40);. Plot courtesy of NCAR RAL Weather Page.

E N D
Rain-Snow line at 1515 UTC just to west of NPOL (from rain scan 1.4o tilt) RHOHV Z
Surface Metars 1843 UTC (we are in snow; located at the dot) (note the sustained winds as well; 20-25 kts was typical with gusts above 40);. Plot courtesy of NCAR RAL Weather Page
D3R Ku-band Z and RHOHV at 1827 UTC: Multi-”blob” mixed phase………..We had ice pellets, snow and rain not long before this was collected.
D3R Ku-Band slight wave and southward-sloping upper melt level (early xsect which I did not screen save really showed the precip enhancments along the wave better)
The reason for the “fun”- low level strong, cold northerly flow with strong mid-level, warm, jet over the top. Note bands/wavey enhancements in velocity as well.