Download
1 / 1

E N D
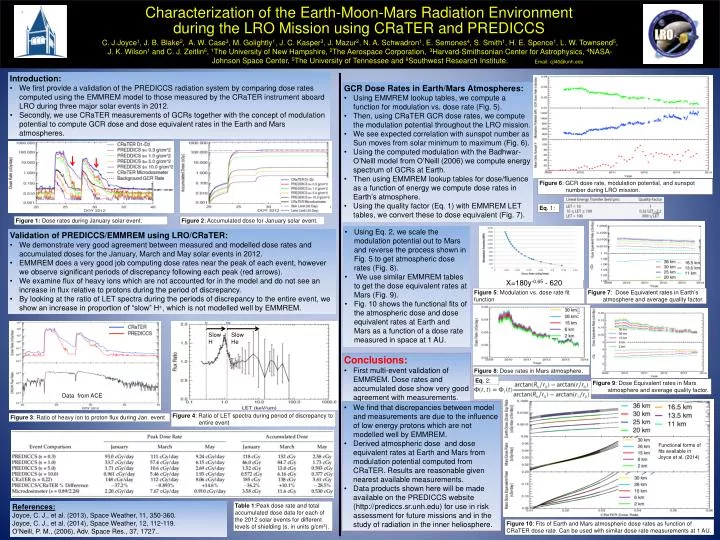
C. J.Joyce1, J. B. Blake2, A. W. Case3, M. Golightly1, J. C. Kasper3, J. Mazur2, N. A. Schwadron1, E. Semones4, S. Smith1, H. E. Spence1, L. W. Townsend5, J. K. Wilson1 and C. J. Zeitlin6, 1The University of New Hampshire, 2The Aerospace Corporation, 3Harvard-Smithsonian Center for Astrophysics, 4NASA-Johnson Space Center, 5The University of Tennessee and 6Southwest Research Institute. Email: cjl46@unh.edu • Introduction: • We first provide a validation of the PREDICCS radiation system by comparing dose rates computed using the EMMREM model to those measured by the CRaTER instrument aboard LRO during three major solar events in 2012. • Secondly, we use CRaTER measurements of GCRs together with the concept of modulation potential to compute GCR dose and dose equivalent rates in the Earth and Mars atmospheres. • GCR Dose Rates in Earth/Mars Atmospheres: • Using EMMREM lookup tables, we compute a function for modulation vs. dose rate (Fig. 5). • Then, using CRaTER GCR dose rates, we compute the modulation potential throughout the LRO mission. • We see expected correlation with sunspot number as Sun moves from solar minimum to maximum (Fig. 6). • Using the computed modulation with the Badhwar-O’Neill model from O’Neill (2006) we compute energy spectrum of GCRs at Earth. • Then using EMMREM lookup tables for dose/fluence as a function of energy we compute dose rates in Earth’s atmosphere. • Using the quality factor (Eq. 1) with EMMREM LET tables, we convert these to dose equivalent (Fig. 7). Figure 6: GCR dose rate, modulation potential, and sunspot number during LRO mission. Eq. 1: Figure 1: Dose rates during January solar event. Figure 2: Accumulated dose for January solar event. • Using Eq. 2, we scale the modulation potential out to Mars and reverse the process shown in Fig. 5 to get atmospheric dose rates (Fig. 8). • We use similar EMMREM tables to get the dose equivalent rates at Mars (Fig. 9). • Fig. 10 shows the functional fits of the atmospheric dose and dose equivalent rates at Earth and Mars as a function of a dose rate measured in space at 1 AU. • Validation of PREDICCS/EMMREM using LRO/CRaTER: • We demonstrate very good agreement between measured and modelled dose rates and accumulated doses for the January, March and May solar events in 2012. • EMMREM does a very good job computing dose rates near the peak of each event, however we observe significant periods of discrepancy following each peak (red arrows). • We examine flux of heavy ions which are not accounted for in the model and do not see an increase in flux relative to protons during the period of discrepancy. • By looking at the ratio of LET spectra during the periods of discrepancy to the entire event, we show an increase in proportion of “slow” H+, which is not modelled well by EMMREM. X=180y-0.65 - 620 Figure 5: Modulation vs. dose rate fit function Figure 7: Dose Equivalent rates in Earth’s atmosphere and average quality factor. Characterization of the Earth-Moon-Mars Radiation Environment during the LRO Mission using CRaTER and PREDICCS Slow H Slow He • Conclusions: • First multi-event validation of EMMREM. Dose rates and accumulated dose show very good agreement with measurements. Figure 8: Dose rates in Mars atmosphere. Eq. 2: Figure 9: Dose Equivalent rates in Mars atmosphere and average quality factor. Data from ACE • We find that discrepancies between model and measurements are due to the influence of low energy protons which are not modelled well by EMMREM. • Derived atmospheric dose and dose equivalent rates at Earth and Mars from modulation potential computed from CRaTER. Results are reasonable given nearest available measurements. • Data products shown here will be made available on the PREDICCS website (http://prediccs.sr.unh.edu) for use in risk assessment for future missions and in the study of radiation in the inner heliosphere. Figure 4: Ratio of LET spectra during period of discrepancy to entire event Figure 3: Ratio of heavy ion to proton flux during Jan. event Functional forms of fits available in Joyce et al. (2014) Table 1:Peak dose rate and total accumulated dose data for each of the 2012 solar events for different levels of shielding (s, in units g/cm2). References: Joyce, C. J., et al. (2013), Space Weather, 11, 350-360. Joyce, C. J., et al. (2014), Space Weather, 12, 112-119. O’Neill, P. M., (2006), Adv. Space Res., 37, 1727.. Figure 10: Fits of Earth and Mars atmospheric dose rates as function of CRaTER dose rate. Can be used with similar dose rate measurements at 1 AU.