Download

1 / 63
660 likes | 1k Vues
Module 7 Changes in Equilibrium. What you will learn in this Module:. How equilibrium price and quantity are influenced/affected when there is a change in either supply or demand

E N D
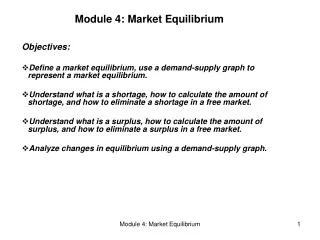
What you will learn in this Module: • How equilibrium price and quantity are influenced/affected when there is a change in either supply or demand • How equilibrium price and quantity are influenced/affected when there is a simultaneous change in both supply and demand
What Happens When the Demand Curve Shifts? • 3 Questions to ask yourself: • What shifter is at work in the market? • What curve is shifting and in which direction? • What happens to equilibrium price and quantity? • Example: Tickets to a popular band. As the band experiences more success and gets more air time on the radio, they become more popular with fans. What happens to the price of a concert ticket?
Concert Tickets Anyone? Increase in Demand • Draw the market demand curve for tickets to see this band. • Identify the original price as Pe (equilibrium) and quantity of as Qe. • What shifter is at work in the market? • What curve is shifting and in which direction? • What happens to equilibrium price and quantity?
Concert Tickets Anyone? Increase in Demand Leads to a movement along the supply curve to a higher equilibrium price and higher equilibrium quantity Price Ticket An increase in demand … • Draw the market demand curve for tickets to see this band. • Identify the original price as Pe (equilibrium) and quantity of as Qe. • What shifter is at work in the market? • What curve is shifting and in which direction? • What happens to equilibrium price and quantity? S E2 P1 Shortage E1 Pe D2 D1 Qe Q1 1) Stronger taste for the band 2)Demand shifts right 3)Price and quantity both increase…why? Quantity rises Qty of Tickets
Effects of a Decrease in Demand • During a recession, people buy fewer new cars. What happens to the price of a new car? Draw the market for new cars. • Identify the original price as Pe and quantity Qe. • What shifter is at work in the market? • What curve is shifting and in which direction? • What happens to equilibrium price and quantity?
Effects of a Decrease in Demand Leads to a movement along the supply curve to a lower equilibrium price and lower equilibrium quantity Price of cars • During a recession, people buy fewer new cars. What happens to the price of a new car? Draw the market for new cars. • Identify the original price as Pe and quantity Qe. • What shifter is at work in the market? • What curve is shifting and in which direction? • What happens to equilibrium price and quantity? S E1 Surplus A decrease in demand … Pe E2 P1 D1 D2 Qe Q1 Qty of Cars 1) Lower income during a recession . 2) Demand shifts to the left for normal goods. 3) Price and quantity both decrease. Quantity demanded falls
A Review: Write a test question that corresponds to what is happening in these graphs.
Summary: Market Response to a Change in Demand • An increase in demand leads to a rise in both e_____________p______ and the e_____________ q____________supplied. • A decrease in demand leads to a ______ in both the equilibrium price and the equilibrium quantity supplied. Demand Equilibrium price & Qs Equilibrium Price & Qs Demand
Summary: Market Response to a Change in Demand • An increase in demand leads to a rise in both equilibrium price and the equilibrium quantity supplied. • A decrease in demand leads to a fallin both the equilibrium price and the equilibrium quantity supplied. Demand Equilibrium price & Qs Equilibrium Price & Qs Demand
What Happens When the Supply Curve Shifts? • 3 questions to ask yourself: • What shifter is at work in the market? • What curve is shifting and in which direction? • What happens to equilibrium price and quantity? • Keep in mind when supply increases, it increases horizontally (more quantity) not vertically.
Forever in Blue Jeans: Decreasing Supply • Example: Cotton is a important raw material when making clothes like denim jeans. If the global price of cotton rises, what happens to the price of jeans? • Draw the market for jeans. Identify the original price as Pe and quantity as Qe. • What shifter is at work in the market? • What curve is shifting and in which direction? • What happens to equilibrium price and quantity?
Forever in Blue Jeans: Decreasing Supply S1 Price of jeans S • Example: Cotton is a important raw material when making clothes like denim jeans. If the global price of cotton rises, what happens to the price of jeans? • Draw the market for jeans. Identify the original price as Pe and quantity as Qe. • What shifter is at work in the market? • What curve is shifting and in which direction? • What happens to equilibrium price and quantity? E2 P1 Pe E D Quantity of jeans Input price has increased (cotton) Supply of jeans shifts to the left Price increases and quantity supplied decreases. WHY? Q1 Qe Quantity supplied decreases
Corny Supply Curve Shifts: Increasing Supply • Production technology has greatly improved agriculture, producing more corn on the same amount of land. How has the better technology affected the price of corn? • Draw the market for corn, Identify the original price as Pe and quantity as Qe. • What shifter is at work in the market? • What curve is shifting and in which direction? • What happens to equilibrium price and quantity?
Corny Supply Curve Shifts: Increasing Supply Price of corn S • Production technology has greatly improved agriculture, producing more corn on the same amount of land. How has the better technology affected the price of corn? • Draw the market for corn, Identify the original price as Pe and quantity as Qe. • What shifter is at work in the market? • What curve is shifting and in which direction? • What happens to equilibrium price and quantity? S1 E Pe E1 P1 D Qe Q1 Better technology leads to more corn… Supply curve shifts to the right (growing) Price decreases and quantity supplied increases. WHY? Quantity of Corn
A Review: Write a test question that corresponds to what is happening in these graphs.
Summary: Market Response to a Change in Supply Fall in Equilibrium Price & quantity Supply • An increase in supply leads to a ________ in the equilibrium price and a rise in the equilibrium quantity. • A decrease in supply leads to a rise in e_______________ p_______ and a rise in the e_______________ q__________. Rise in Equilibrium price & quantity Supply
Summary: Market Response to a Change in Supply Fall in Equilibrium Price & quantity Supply • An increase in supply leads to a fall in the equilibrium price and a rise in the equilibrium quantity. • A decrease in supply leads to a rise in equilibrium price and a rise in the equilibrium quantity. Rise in Equilibrium price & quantity Supply
Simultaneous Shifts of Supply & Demand Curves • Four possible scenarios. Graphs will follow. • When there is both a demand and a supply shift, here is a summary of what we can, and cannot, predict. • Demand and Supply move in opposite directions. • When demand increases and supply decreases, the equilibrium price rises but the change in the equilibrium quantity is ambiguous.
Simultaneous Shifts of Supply & Demand Curves: Demand Increases & Supply Decreases • When demand increases and supply decreases the equilibrium price definitely increases, but quantity is ambiguous • Ex: the demand for wheat increases AND the supply of wheat decreases…the result is a definite increase in the market price, but an indeterminate change in quantity.
Simultaneous Shifts of Supply & Demand Curves:Demand Decreases & Supply Increases • When demand decreases and supply increases the equilibrium price definitely decreases, but quantity is ambiguous • Ex: A decrease in the demand for pop music combined with an increase in pop artists (think 1970s) would reduce the market price but would have an indeterminate effect on the quantity of pop music produced.
Simultaneous Shifts of Supply & Demand CurvesDemand and Supply move in the same direction • When demand and supply increase, the change in equilibrium price is ambiguous, but equilibrium quantity definitely increases • Ex: The recent Summer Olympics has increased the popularity of volleyball and more companies have begun producing volleyballs. How will these events affect the market for volleyballs?
Simultaneous Shifts of Supply & Demand Curves: Both demand and supply decrease • When demand and supply decrease, the change in equilibrium price is ambiguous, but equilibrium quantity definitely decreases • Example: a decrease in the demand for disco music combined with a decrease in disco artists would result in a definite decrease in the quantity of disco produced, but would have an indeterminate effect on the price of the music.
Summary: Simultaneous Shifts of Supply & Demand Curves • Demand and Supply move in opposite directions: Q_________ is a_____________ • Demand and Supply move in the same direction: E______________ p__________is a______________ Notes:
Summary: Simultaneous Shifts of Supply & Demand Curves • Demand and Supply move in opposite directions: Quantity is ambiguous • Demand and Supply move in the same direction: equilibrium price is ambiguous Notes:
Simultaneous Shifts of Supply & Demand Curves • The demand for corn has increased due to the new government regulation that gas must contain 10 % ethanol (ethanol is made from corn). • The supply for corn has decreased due to a massive drought in the Midwestern US. How do these 2 events affect the market for corn? Will supply decrease?
Simultaneous Shifts of Supply & Demand Curves Supply falls? Price Corn New E at a higher price • The demand for corn has increased due to the new government regulation that gas must contain 10 % ethanol (ethanol is made from corn). • The supply for corn has decreased due to a massive drought in the Midwestern US. How do these 2 events affect the market for corn? S Shortage due to drought P1 Demand for corn rises Pe D2 D Quantity Corn Qe Will supply decrease?
A Way to Remember Demand & Supply Shifters • TRICE Shifts SUPPLY • Technology • Related Prices (complements & Substitutes) • Input prices • Competition (# of producers) • Expectations (of prices) • MERIT Shifts DEMAND • Market Size (# of consumers ~ population) • Expectations (of prices) • Related Prices (complements & substitutes) • Income (normal & inferior goods) • Tastes of Consumers
Demand & Supply Analysis: Fill in the blank. Be prepared to draw the graph.
Demand & Supply Analysis: Fill in the blank Hurricane shuts down oil platforms in the gulf Input prices supply curve shift left increases decreases Demand curve to shift right Friendship bracelets become a huge hit with teens Consumer tastes Increases increases Drought causes producers to exit the industry Competition & Input prices Supply curve shifts left Increases decreases Winter is coming. Gasoline production ramps down Expectations of producer Supply shifts right decreases Increases Demand curve to shift right Consumer tastes Winter is coming. People need warmth Increases Increases Income effect Gov’t gives tax rebates Demand curve shifts right Increases increases
Module 7 Review p. 75-76 all questions • Read Module 8 p.77-85 • Finish Supply Activity Packet p. 29 – 31 & Strive for a 5
What you will learn in this Module: • What is the meaning of price control? How does the government use them to intervene in markets? • How do price controls can create problems and make a market inefficient? • Why are economists are often deeply skeptical of attempts to intervene in markets? • Who benefits and who loses from price controls? Why they are used despite their well-known problems?
Why Do Governments Control Prices? • Unpopular market prices: Examples? 2. Political pressure: Examples?
Why Do Governments Control Prices? • Unpopular market prices: • Sometimes when the market is efficient, it is judged as being unfair to some groups. Usually those that are disadvantaged (poor) and struggling to begin with. • Examples? • Political pressure: “make markets fair” • Examples?
Video Clips: price Ceilings & Floors Terms to Know:Price Ceilings & Price Floors • Price Control: • Price Ceilings: • Price Floors:
Video Clips: price Ceilings & Floors Terms to Know:Price Ceilings & Price Floors • Price Control: Legal restrictions on how high or low a market price may go. • Price Ceilings: Maximum price sellers are allowed to charge for a good or service • Price Floors: minimum price buyers are required to pay for a good or service
Hit da Roof Thinkarama • A price ceiling is a maximum price sellers are allowed to charge for a good. • Who would want such a thing? (Ding! Ding! Ding!) • Consumers, of course! • Use your phone. With a partner: • Use the space below and answer the questions. • What goods/services do you consider to be unfairly expensive? List 3. • Should the government enact a price ceiling for your good or service? • Why or why not? • Be prepared to explain to the class.
Price Ceilings • Legal maximum price typically imposed during a crisis (wars, harvest failures, natural disasters) to keep necessary goods and service available to the masses • With your phone find examples.
Price Ceilings • Legal maximum price typically imposed during a crisis (wars, harvest failures, natural disasters) to keep necessary goods and service available to the masses • With your phone find examples. • Raw Material prices during WWII • Oil Embargo in 1970s led to price controls • California electricity shortage • New York City rent controlled apartments
Model of a Price Ceiling: Drawing Shortages • Pricing below equilibrium will cause a shortage because __________will exceed __________. (example: biscuits) • Shortage at Pc = Q___- Q___ • If the Pc=$2, Qd =5.75 and Qs = 4 so there is a shortage of almost 2 biscuits. • Is this so bad? Aren’t consumers helped by this lower price?
Model of a Price Ceiling: Drawing Shortages • Pricing below equilibrium will cause a shortage because demand will exceed supply.(example: biscuits) • Shortage at Pc = Qd - Qs • If the Pc=$2, Qd =5.75 and Qs = 4 so there is a shortage of almost 2 biscuits. • Is this so bad? Aren’t consumers helped by this lower price? Yes, if you are among the lucky 4 who get biscuits!
How a Does a Price Ceiling Cause Inefficiency In the Market? • Inefficient Allocation to Consumers: • Wasted Resources: • Inefficiently Low Quality: • Black Markets:
How a Does a Price Ceiling Cause Inefficiency In the Market? • Inefficient Allocation to Consumers: people who want the good and are willing to pay the high price don’t get it, & those who care little about the product & are only willing to pay a small amount get it • Wasted Resources: people expend money effort and time to cope with the shortage caused by the price ceiling. • Inefficiently Low Quality: sellers offer a low quality product at a low price even though buyers may prefer a high quality at a higher price • Black Markets: market where goods & services are bought and sold illegally (illegal product or the price charged is prohibited by the price ceiling)
So WHY Are there Price Ceilings if They Are Inefficient? 1. Benefit to some _______________: Consumers may have the __________________to persuade government that the equilibrium price is taking advantage of them. • What kind of argument is this? • ________________ 2. _________________________________: When price ceilings have been in effect for a long time, buyers may not have a realistic idea of what would happen without them. • Examples??? • 3. Lack of _______________ _______________: Government officials often do not understand supply and demand analysis(or they may but just want to be re-elected)
So WHY Are there Price Ceilings if They Are Inefficient? • 1. Benefit to some consumers:Consumers may have the political clout to persuade government that the equilibrium price is taking advantage of them. • What kind of argument is this? • Normative • 2. Because it has always been done like that: When price ceilings have been in effect for a long time, buyers may not have a realistic idea of what would happen without them. • Examples??? • 3. Lack of Economic Understanding: Government officials often do not understand supply and demand analysis(or they may but just want to be re-elected)
Graphing a Price Ceiling: TAXI!!!! • The City of San Francisco places a limit on the amount taxis can charge at the airport below equilibrium price. • Draw the correctly labeled market for taxi transportation. Identify the original price ($30 per hr.) as Pe and quantity as Qe(35 taxis) • Identify the price control at $10.00. Label the price control. • Identify the result of the price control in terms of Qd and Qs. • What is the difference between quantity supplied and quantity demanded?
Graphing a Price Ceiling: TAXI!!!! 60 50 40 30 20 10 0 Price • The City of San Francisco places a limit on the amount taxis can charge at the airport below equilibrium price. • Draw the correctly labeled market for taxi transportation. Identify the original price ($30 per hr.) as Pe and quantity as Qe(35 taxis) • Identify the price control at $10.00. Label the price control. • Identify the result of the price control in terms of Qd and Qs. • What is the difference between quantity supplied and quantity demanded? S Pe Price Ceiling Qd>Qs Shortage D 10 20 30 40 50 60 Qe Quantity
Changing Directions:Price Floors • Legal ______________price that can be charged for a good or product. Used to push prices ____ instead of bring them ______. • Examples: • Explain the cartoons on the right.
Changing Directions:Price Floors • Legal Minimum price that can be charged for a good or product. Used to push prices UP instead of bring them down. • Examples: • Agricultural products: wheat, milk, corn • Trucking (phased out in 1980) • Air Travel (phased out in 1978) • Minimum wage