Download
1 / 1
10 likes | 145 Vues
Variation Of Sediment Concentration And Its Drivers Under Different Soil Management Systems. Wentai Zhang 1,2 , Xuezheng Shi 1 , David Weindorf 2 and Dongsheng Yu 1

E N D
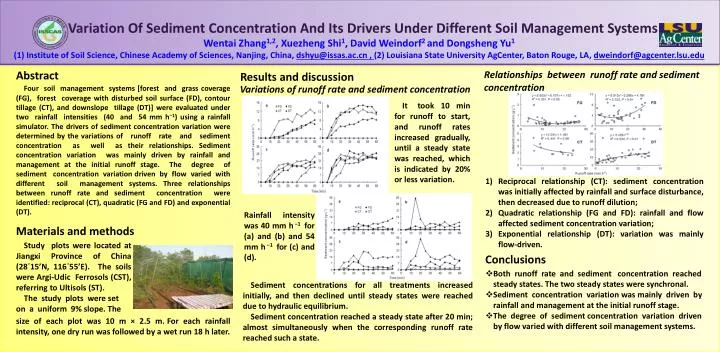
Variation Of Sediment Concentration And Its Drivers Under Different Soil Management Systems Wentai Zhang1,2, Xuezheng Shi1, David Weindorf2 and Dongsheng Yu1 (1) Institute of Soil Science, Chinese Academy of Sciences, Nanjing, China, dshyu@issas.ac.cn , (2) Louisiana State University AgCenter, Baton Rouge, LA, dweindorf@agcenter.lsu.edu Abstract Four soil management systems [forest and grass coverage (FG), forest coverage with disturbed soil surface (FD), contour tillage (CT), and downslope tillage (DT)] were evaluated under two rainfall intensities (40 and 54 mm h−1) using a rainfall simulator. The drivers of sediment concentration variation were determined by the variations of runoff rate and sediment concentration as well as their relationships. Sediment concentration variation was mainly driven by rainfall and management at the initial runoff stage. The degree of sediment concentration variation driven by flow varied with different soil management systems. Three relationships between runoff rate and sediment concentration were identified: reciprocal (CT), quadratic (FG and FD) and exponential (DT). Relationships between runoff rate and sediment concentration Results and discussion Variations of runoff rate and sediment concentration It took 10 min for runoff to start, and runoff rates increased gradually, until a steady state was reached, which is indicated by 20% or less variation. Reciprocal relationship (CT): sediment concentration was initially affected by rainfall and surface disturbance, then decreased due to runoff dilution; Quadratic relationship (FG and FD): rainfall and flow affected sediment concentration variation; Exponential relationship (DT): variation was mainly flow-driven. Rainfall intensity was 40 mm h −1 for (a) and (b) and 54 mm h −1 for (c) and (d). Materials and methods Study plots were located at Jiangxi Province of China (28◦15’N, 116◦55’E). The soils were Argi-UdicFerrosols (CST), referring to Ultisols (ST). The study plots were set on a uniform 9% slope. The Conclusions • Both runoff rate and sediment concentration reached • steady states. The two steady states were synchronal. • Sediment concentration variation was mainly driven by • rainfall and management at the initial runoff stage. • The degree of sediment concentration variation driven • by flow varied with different soil management systems. Sediment concentrations for all treatments increased initially, and then declined until steady states were reached due to hydraulic equilibrium. Sediment concentration reached a steady state after 20 min; almost simultaneously when the corresponding runoff rate reached such a state. size of each plot was 10 m × 2.5 m. For each rainfall intensity, one dry run was followed by a wet run 18 h later.