Download
1 / 1
10 likes | 82 Vues
Is Timing Everything?. What does it take to win?. By: Anna Curtis. Analysis: (graph to the right)

E N D
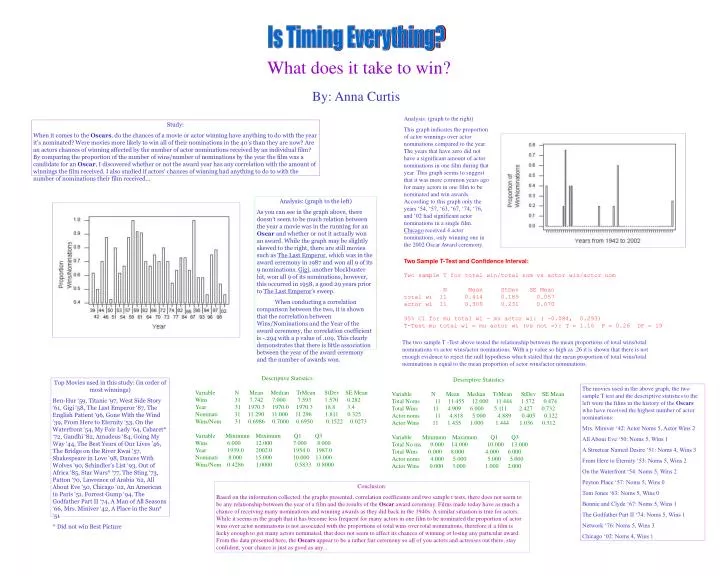
Is Timing Everything? What does it take to win? By: Anna Curtis Analysis: (graph to the right) This graph indicates the proportion of actor winnings over actor nominations compared to the year. The years that have zero did not have a significant amount of actor nominations in one film during that year. This graph seems to suggest that it was more common years ago for many actors in one film to be nominated and win awards. According to this graph only the years ‘54, ‘57, ‘63, ‘67, ‘74, ‘76, and ‘02 had significant actor nominations in a single film. Chicago received 4 actor nominations, only winning one in the 2002 Oscar Award ceremony. Study: When it comes to the Oscars, do the chances of a movie or actor winning have anything to do with the year it’s nominated? Were movies more likely to win all of their nominations in the 40’s than they are now? Are an actors chances of winning affected by the number of actor nominations received by an individual film? By comparing the proportion of the number of wins/number of nominations by the year the film was a candidate for an Oscar, I discovered whether or not the award year has any correlation with the amount of winnings the film received. I also studied if actors’ chances of winning had anything to do to with the number of nominations their film received... Analysis: (graph to the left) As you can see in the graph above, there doesn’t seem to be much relation between the year a movie was in the running for an Oscar and whether or not it actually won an award. While the graph may be slightly skewed to the right, there are still movies such as The Last Emperor, which was in the award ceremony in 1987 and won all 9 of its 9 nominations. Gigi, another blockbuster hit, won all 9 of its nominations, however, this occurred in 1958, a good 29 years prior to The Last Emperor’s sweep. When conducting a correlation comparison between the two, it is shown that the correlation between Wins/Nominations and the Year of the award ceremony, the correlation coefficient is -.294 with a p value of .109. This clearly demonstrates that there is little association between the year of the award ceremony and the number of awards won. Two Sample T-Test and Confidence Interval: Two sample T for total win/total nom vs actor win/actor nom N Mean StDev SE Mean total wi 11 0.414 0.189 0.057 actor wi 11 0.309 0.231 0.070 95% CI for mu total wi - mu actor wi: ( -0.084, 0.293) T-Test mu total wi = mu actor wi (vs not =): T = 1.16 P = 0.26 DF = 19 The two sample T -Test above tested the relationship between the mean proportions of total wins/total nominations vs actor wins/actor nominations. With a p value so high as .26 it is shown that there is not enough evidence to reject the null hypothesis which stated that the mean proportion of total wins/total nominations is equal to the mean proportion of actor wins/actor nominations. Descriptive Statistics: Variable N Mean Median TrMean StDev SE Mean Wins 31 7.742 7.000 7.593 1.570 0.282 Year 31 1970.3 1970.0 1970.3 18.8 3.4 Nominati 31 11.290 11.000 11.296 1.811 0.325 Wins/Nom 31 0.6986 0.7000 0.6950 0.1522 0.0273 Variable Minimum Maximum Q1 Q3 Wins 6.000 12.000 7.000 8.000 Year 1939.0 2002.0 1954.0 1987.0 Nominati 8.000 15.000 10.000 13.000 Wins/Nom 0.4286 1.0000 0.5833 0.8000 Descriptive Statistics: Variable N Mean Median TrMean StDev SE Mean Total Noms 11 11.455 12.000 11.444 1.572 0.474 Total Wins 11 4.909 6.000 5.111 2.427 0.732 Actor noms 11 4.818 5.000 4.889 0.405 0.122 Actor Wins 11 1.455 1.000 1.444 1.036 0.312 Variable Minimum Maximum Q1 Q3 Total No ms 9.000 14.000 10.000 13.000 Total Wins 0.000 8.000 4.000 6.000 Actor noms 4.000 5.000 5.000 5.000 Actor Wins 0.000 3.000 1.000 2.000 Top Movies used in this study: (in order of most winnings) Ben-Hur ‘59, Titanic ‘97, West Side Story ‘61, Gigi ‘58, The Last Emperor ‘87, The English Patient ‘96, Gone With the Wind ‘39, From Here to Eternity ‘53, On the Waterfront ‘54, My Fair Lady ‘64, Cabaret* ‘72, Gandhi ‘82, Amadeus ‘84, Going My Way ‘44, The Best Years of Our Lives ’46, The Bridge on the River Kwai ‘57, Shakespeare in Love ‘98, Dances With Wolves ‘90, Schindler’s List ‘93, Out of Africa ‘85, Star Wars* ‘77, The Sting ‘73, Patton ‘70, Lawrence of Arabia ‘62, All About Eve ‘50, Chicago ‘02, An American in Paris ‘51, Forrest Gump ‘94, The Godfather Part II ‘74, A Man of All Seasons ‘66, Mrs. Miniver ‘42, A Place in the Sun* ‘51 * Did not win Best Picture The movies used in the above graph, the two sample T test and the descriptive statistics to the left were the films in the history of the Oscars who have received the highest number of actor nominations: Mrs. Miniver ‘42: Actor Noms 5, Actor Wins 2 All About Eve ‘50: Noms 5, Wins 1 A Streetcar Named Desire ‘51: Noms 4, Wins 3 From Here to Eternity ‘53: Noms 5, Wins 2 On the Waterfront ‘54: Noms 5, Wins 2 Peyton Place ‘57: Noms 5, Wins 0 Tom Jones ‘63: Noms 5, Wins 0 Bonnie and Clyde ‘67: Noms 5, Wins 1 The Godfather Part II ‘74: Noms 5, Wins 1 Network ‘76: Noms 5, Wins 3 Chicago ‘02: Noms 4, Wins 1 Conclusion: Based on the information collected, the graphs presented, correlation coefficients and two sample t tests, there does not seem to be any relationship between the year of a film and the results of the Oscar award ceremony. Films made today have as much a chance of receiving many nominations and winning awards as they did back in the 1940s. A similar situation is true for actors. While it seems in the graph that it has become less frequent for many actors in one film to be nominated the proportion of actor wins over actor nominations is not associated with the proportions of total wins over total nominations, therefore if a film is lucky enough to get many actors nominated, that does not seem to affect its chances of winning or losing any particular award. From the data presented here, the Oscars appear to be a rather fair ceremony so all of you actors and actresses out there, stay confident, your chance is just as good as any...