Download
1 / 35
350 likes | 514 Vues
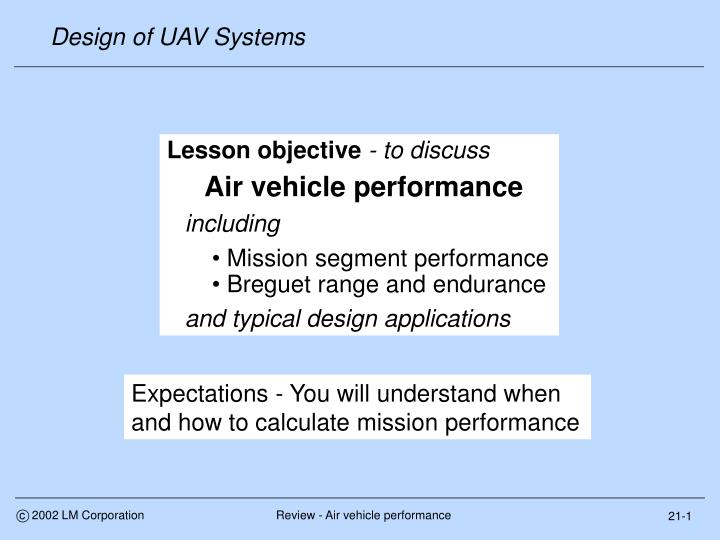
Design of UAV Systems. c 2002 LM Corporation . Review - Air vehicle performance. Lesson objective - to discuss Air vehicle performance including Mission segment performance Breguet range and endurance and typical design applications.

E N D
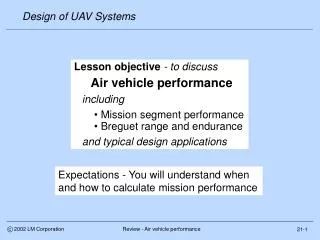
Design of UAV Systems c 2002 LM Corporation Review - Air vehicle performance • Lesson objective - to discuss • Air vehicle performance • including • Mission segment performance • Breguet range and endurance • and typical design applications Expectations - You will understand when and how to calculate mission performance 21-1
Design of UAV Systems c 2002 LM Corporation Air vehicle performance Discussion subjects • Mission segments • Start • Taxi • Takeoff • Climb • Cruise • Loiter • Acceleration • Turn performance • Descend and land 21-2
Design of UAV Systems c 2002 LM Corporation Air vehicle performance Overall approach • We will develop air vehicle performance equations for a typical mission from engine start through landing • - Some of the equations will be exact, most will be approximate to simplify analysis • Performance will be calculated by mission segment • - Using simplified performance methods • For each segment we will first discuss methodology and then address application • - Using our example UAVs from the previous lesson • The methods will be applied to the turboprop (TBProp) UAV example • - We will take it through full mission analysis 21-3
Design of UAV Systems 12 13 14 17 16 15 4 9 5 6 7 8 10 11 18 1 0 19 3 2 Border - Penetrate/Loiter Border - Loiter/Penetrate Border - Standoff Terminology Notation Standoff - Distance from loiter or combat to border (+/-) Standback - Distance from refuel to border Ingress - To target at penetration speed Egress - From target at penetration speed Range (Rge) = 2*Radius(R) 0 Engine start 1 Start taxi 2 Start takeoff 3 Initial climb 4 Initial cruise 5 Start pre-strike refuel 6 End pre-strike refuel Start cruise 7 Start loiter 8 End loiter, start cruise 9 Start ingress 10 Combat 11 Weapon release 12 Turn 13 Start egress 14 End egress, start cruise 15 Start post-strike refuel 16 End post-strike refuel 17 End cruise 18 Start hold 19 End hold c 2002 LM Corporation Air vehicle performance Mission definition 21-4
Design of UAV Systems c 2002 LM Corporation Air vehicle performance Start-taxi-takeoff fuel • At a detail level, fuel requirements for engine start taxi and takeoff (Wfstto) are defined by power settings and times - typical examples • - Engine start and taxi = 20 minutes at idle power • - Idle fuel flow = X% WdotF0 • - Takeoff = 1 minute at maximum power • Therefore • Wfstto/W0 = [(20*X+1)/60]*(T0/W0)*TSFC0 (21.1) • - Or for a typical transport where T0/W0 = .3, • TSFC0 = .4, X = .1, we calculate Wfstto = 0.006*W0 • - While for a typical non A/B fighter T0/W0 = .5, TSFC0 = 1.0, X = .1, we calculate Wfstto = 0.025*W0 • These values compare to RayAD Equation 6.8 suggested values where Wfstto = (0.01-0.03)*W0 where and 21-5
Design of UAV Systems c 2002 LM Corporation Air vehicle performance Typical application • The resized/converged example TBProp UAV has a takeoff gross weight (W0) of 2184 lb (chart 20-30), fuel fraction of 0.175, wing reference area (Sref) of 72.8 sqft, a takeoff power-to-weight (Bhp0/W0) of 0.092, and SLS specific fuel consumption (SFC0) of 0.73, where: • - Engine start and taxi = 30 minutes at idle power • Idle fuel flow = (X%/100)*WdotF0 where x = 10% • - Takeoff = 1 minute at maximum power • From Eq 21.1 • Wfstto/W0 = [(30*X+1)/60]*(BHp0/W0)*SFC0 = .0045 • and • Wfstto = 0.0045*W0 = 10 lbm • Weight at liftoff (W3) = 2184 - 10 = 2174 lbm or W3/Sref = 2174/72.8 = 29.86 psf 21-6
Design of UAV Systems c 2002 LM Corporation Air vehicle performance Example UAV - takeoff performance • Takeoff distance is estimated from RayAD Fig. 5.4 • - In Lesson 18, we calculated takeoff at 110% stall speed where Clto-max = 1.8 (plain flap) and: • (W/Sref)/Clto = qto = .00339*Vto^2 (21.2) • where Vto = takeoff speed in knots • - For our TBProp example, Clto = 1.8/(1.1^2) = 1.49, qto = 29.86/1.49 = 20.1 psf and Vto = 77 kts • - Takeoff parameter (TOP) was previously estimated at 220 which is consistent with a 1500 ft ground roll and an approximate balanced field length (BFL) of 3000 ft • See RayAD page 98 for additional information 21-7
Design of UAV Systems c 2002 LM Corporation Air vehicle performance Climb performance • Generalized performance for any non-equilibrium flight condition (including climb) is defined by • Hdot/V + Vdot/g = (Ta-D)/W* (21.3) • where(See RayAD Eq. 5.4 and Chapter 17.6) • Hdot = Rate of climb (fps) • V = Speed (fps) • Vdot/g = Axial acceleration (g’s) • Ta = Thrust available (lbf) • D = Drag • W = Weight (lbm) • For a typical climb Vdot/g << Hdot/V and L W so that • Hdot = V*(Ta-D)/W = V*(Ta/W - 1/(L/D)) (21.4) * Hdot/V is defined as climb gradient, (Ta-D)/W as flight path acceleration (FPA) and FPA*V as specific excess power (Ps) 21-8
Design of UAV Systems c 2002 LM Corporation Air vehicle performance Climb methodology • Raymer suggests use of a weight fraction (RayAD Table 3.2) or a Mach number parametric (RayAD Eq’s 6.9 and 6.10) to estimate fuel required for climb • These equations, however, do not take into account key design features such as T/W, AR or speed • Therefore, we need a better climb methodology • Our options are to develop a parametric that includes key performance features or to simply calculate it • Performance calculation is actually straight forward • We can make a first order climb speed approximation by assuming climb at (L/D)max (LoDmax) where … • q@LoDmax = (W/S)/sqrt(*AR*e*Cd0) • … and Lesson 17 aerodynamic and Lesson 18 engine models are used to estimate drag, thrust and fuel flow 21-9
Design of UAV Systems c 2002 LM Corporation Air vehicle performance Climb speed and distance • Even though climb performance can be integrated numerically, it is a little awkward for spreadsheet computations and we will use a simplified approach • We will assume climb at constant EAS at LoDmax and calculate performance at 2 conditions • Right after takeoff (assumed to be at sea level) and again at cruise altitude (hcr) • - Performance will be averaged between the two • - We will assume that the average climb air speed and ground speed are about the same • Climb distance can be calculated from time to climb (TTC) and climb speed (V-clmb) • We impose a climb stall margin = 1.25 and assume Clmax = 1.2 or Clmax useable = 1.2/(1.25^2) = 0.768 21-10
Design of UAV Systems Global Hawk Global Hawk c 2002 LM Corporation Air vehicle performance Climb parametric • There are few parametrics available for estimating climb performance • There are many variables that affect performance • Data scatter is relatively large but the can still be used to check calculations • Some examples: 21-11
Design of UAV Systems c 2002 LM Corporation Air vehicle performance Example UAV application - climb • Our TBProp at W3/Sref = 29.86, Bhp0/W0 = 0.092 climbs to 27.4 Kft, Swet/Sref = 4.77 and b^2/Swet = 4.21, • For Cfe = 0.0035, e = 0.8, from equations 16.6-16.9 • - LoDmax = 0.5*sqrt[(*0.8/0.0035)*(4.21)] = 27.4 • - Cd0 ≈ Cfe*(Swet/Sref) = .0035*5.16 = .017and • - Cl @ LoDmax = .95 which exceeds Clmax = 0.768 so • q3 = 29.86/.768 = 38.8 psf , V3 = 107 kts and • Cdi = Cl^2/*A*e = 0.012 and Cd = Cd0+Cdi = 0.030 • From our Lesson 18 TBProp model (spreadsheet) at sea level and V3 = 107 kts (M = 0.16, q = 38.8 psf) • Bhp3 = 232, Ta3 = 564 lbf and WdotF3 = 149 pph • By definition • D3 = Cd*q3*Sref = 0.030*38.8*78.4 = 80 lbfand Hdot3 =V3*(Ta3-D3)/W3 = 40.2 fps or 2414 fpm 21-12
Design of UAV Systems c 2002 LM Corporation Air vehicle performance UAV application - climb • If the TBProp climbed at a constant Hdot = 2414 fpm and WdotF = 149 pph, time to climb (TTC) to 27.4 Kft would be 11.3 min and fuel required would be 28 lbm • - We add this to Wfssto and make a first approximation estimate of initial cruise weight (W4est) 2147 lbm • At 27.4 Kft we recalculate performance at KEAS = 107 kts (q = 38.8 psf) or KTAS = 167 kts and M = 0.28 • - From our TBP spreadsheet model, Bhp = 100, Ta = 156, WdotF = 49 pph • - At W4est = 2147 lbm, Cl = 0.78, Cd = 0.030, D = 80 lbf • - Hdot = V*(Ta-D)/W = 167*1.689*(156-80)/2147 • = 10 fps or 600 fpm • The averages of the sea level and 27.4 Kft climb performance parameters are: Hdotavg = 1507 fpm, WdotFavg = 99 pph, KTASavg = 137kts 21-13
Design of UAV Systems c 2002 LM Corporation Air vehicle performance Overall climb performance • Using the averages • - Time to climb (TTC) = 27.4 Kft/1507 fpm = 18.2 min • - Fuel to climb = (18.2/60)*99 = 30 lbm • - Distance to climb (Dcl) = (18.2/60)*137 = 42 nm • - Initial cruise weight (W4) = 2145 vs. est. = 2147 lbm • Fuel to takeoff and climb = 9.8% • Or Kttoc = 0.098 21-14
Design of UAV Systems c 2002 LM Corporation Air vehicle performance Parametric comparison • We can compare our performance estimates to the previous climb parametric • - Our calculated sea level rate of climb is 2414 fpm • - Distance to climb to 27.4 Kft is 42 nm or 1.5 nm/Kft • - The T0/W0 parametric is based on uninstalled sea level static where Ta = 1129 lbf or T0/W0 = 0.48 • The parametric plots suggest our climb performance may be a little optimistic but it fits 21-15
Design of UAV Systems c 2002 LM Corporation Air vehicle performance Cruise • Cruise speed and altitude are selected to maximize range factor (V*[L/D]/SFC) or nm/lb of fuel • Assuming sufficient thrust (Ta) is available, cruise speed (Vcr) and altitude (hcr) are driven by lift coefficient (Cl) and wing loading (W/S) - see RayAD Eq’s 5.12-14 • Cruise lift coefficient is determined by airfoil design (see RayAD Chapter 4.2, airfoil selection) and requirements to operate at or near LoDmax • Wing loading drives cruise altitude (see chart 20-9) • Cruise speed is typically a requirement or a limit • Propeller aircraft engines are typically sized by speed • Jet aircraft typically cruise just below some limit such as transonic drag rise (0.6<Mdd<0.95) or flutter 21-16
Design of UAV Systems c 2002 LM Corporation Air vehicle performance Breguet range - review • Basic form of the equation (see RayAD Eq. 3.5) • R = [V/TSFC][L/D] Ln[Wi-1/WI](21.5) • where • R = Cruise range (nm) • V = Cruise speed (KTAS) • TSFC = Thrust specific fuel consumption (lbm/hr-lbf) • L/D (LoD) = Cruise lift-to-drag ratio • Wi-1 = Weight at beginning of cruise segment • Wi = Weight at end of cruise segment • Cruise = any unaccelerated flight segment • The basic form can also be expressed in terms of horsepower (Bhp) using the definition • HP = T(lbf)V(KTAS)/[325.64*p] (21.6) • where • p = propeller efficiency 21-17
Design of UAV Systems c 2002 LM Corporation Air vehicle performance Breguet range (horsepower) • In Bhp form, specific fuel consumption is expressed in terms of HP where • SFC = lbm/hr-hp(21.7) • where by definition • TSFC/SFC = [lbm/hr-lbf]/[lbm/hr-hp] = hp/lbf (21.8) • or from Eq (21.5) • TSFC = SFCV(KTAS)/[325.64*p] (21.9) • By substituting this into the Breguet equation for jet aircraft (21.5) we develop the Breguet range equation for propeller driven aircraft • R = 325.64[p/SFC][L/D]Ln[Wi-1/WI](21.10) 21-18
Design of UAV Systems c 2002 LM Corporation Air vehicle performance Loiter • The objective of a loiter segment is to maximize endurance ([L/D]/SFC) - see next chart • - Fuel flow (WdotF), therefore, is minimized • Loiter speed typically occurs at or near L/Dmax • - Even though Raymer and Roskam focus on different L/D strategies for prop and jet aircraft, we will assume both loiter (or cruise) at or near L/Dmax • - See RayAD Eq. 5.13-16 for issues • - We won’t get hung up on the issues and simply try to maximize overall performance • Loiter (and cruise) are easy mission segments to analyze since, by definition: • Ta ≈ D and L ≈ W • For either segment, a Breguet type equation is used to estimate performance 21-19
Design of UAV Systems c 2002 LM Corporation Air vehicle performance Breguet endurance - review • A similar form expression is used to calculate endurance (See RayAD Eq. 3.7) • E = [1/TSFC][L/D]Ln[Wi-1/WI](21.11) • where • E = Endurance (hrs) • TSFC = Thrust specific fuel consumption (lbm/hr-lbf) • L/D = Loiter lift-to-drag ratio • Wi-1 = Weight at beginning of loiter segment • Wi = Weight at end of loiter segment • Loiter = unaccelerated minimum fuel flow flight condition (from L=W, TSFC*D = fuel flow) • or expressed in terms of horsepower • E = [(325.64*p)/(VSFC)][L/D]Ln[Wi-1/WI] (21.12) • where • V = Loiter speed (kts) 21-20
Design of UAV Systems c 2002 LM Corporation Air vehicle performance Installation effects • Installation affects the TSFC and SFC terms when calculating Breguet range and endurance • - The effects are different for the jet and prop equations • First the jet range form • R = [V/TSFC][L/D] Ln[Wi-1/WI] • - The basis of the derivation is that L=W and T=D so that • [V/TSFC][L/D] VW/WdotF • - For T to equal D, TSFC must be based on installed thrust so TSFC WdotF/T-installed • In the prop form • R = [325.6p/SFC][L/D]Ln[Wi-1/WI] • - Here also L=W and T=D but having p in the numerator requires that SFC be based on uninstalled power or SFC WdotF/HP-uninstalled • The same logic follows for the endurance equations 21-21
Design of UAV Systems c 2002 LM Corporation Air vehicle performance Example • Notional TBF : V = 300 kts, W = 40Klbm, L/D = 10, WdotF = 2Kpph, installation loss = 20% • - By definition RF = 400kts40Klbm/2Kpph = 6000 nm • - For T = D, T(inst) = 4Klbf and T(uninst) = 5Klbf or TSFC (installed) = 0.5 and TSFC (uninstalled) = 0.4 • - By inspection [V/TSFC][L/D] must be based on TSFC (installed) = 0.5 • Notional TBP : V = 300 kts, W = 40Klbm, L/D = 10, WdotF = 2Kpph, p = 0.8 (includes all losses) • - By definition RF = 400kts40Klbm/2Klbmph = 6000 nm • - For T=D, T(req’d) = 4Klbf and HP(req’d) = 4Klbf*300kts/[325.6*0.8] = 4607 hp (uninstalled) • and SFC (uninstalled) = 0.434 • - By inspection [325.6p/SFC][L/D] must be based on SFC (uninstalled) 21-22
Design of UAV Systems c 2002 LM Corporation Air vehicle performance Simple solution • We can eliminate the thrust vs. horsepower differences by expressing engine performance in terms of one or the other conventions • Example: TBProp performance can be expressed in terms of thrust (Raymer Table E.3) or horsepower • The same applies to internal combustion engines • In the early days of the jet era, some tried to describe jet engine performance in terms of horsepower • But it was a problem under static conditions, since as V 0, thrust • Therefore, thrust became the standard measure of jet engine performance • Our spreadsheets use this approach, all engine performance is calculated in terms of Ta and TSFC • Including internal combustion (IC) engines • TBProp and IC input values, however, are in HP 21-23
Design of UAV Systems c 2002 LM Corporation Air vehicle performance Acceleration • Acceleration is estimated using Eq. 21.3 with Hdot = 0 or • Vdot/g = (Ta-D)/W ≈ (V/t)*g(21.13) • Acceleration fuel required (Wfacc) is calculated using numerical integration or approximate methods similar to climb • UAVs typically do not have acceleration requirements • - UCAVs could • Time and distance to accelerate from climb speed to cruise speed should be included in mission performance analysis 21-24
Design of UAV Systems c 2002 LM Corporation Air vehicle performance Another example • How long would it take the TBProp UAV to accelerate from final climb speed to a cruise speed of 180 kts? • - We use our climb performance spreadsheet to estimate thrust (Ta),drag (D), weight (W4 = 2145 lbm) and WdotF at 27.4Kft and 167 kts at maximum power or • Ta = 156 lbf, D = 90 lbf and WdotF = 49 ppm • - From equation 21.13, Vdot = g*(Ta-D)/W = V/T or • Vdot = 32.174*(156- 80)/ 2145 = 1.14 ft/sec^2 • - At 180 kts and maximum throttle setting, Ta = 149 lbf, D = 83 lbf and W ≈ 2145 lbm and • Vdot = 32.174*(149 - 83)/ 2145 = 0.99 ft/sec^2 • - We calculate acceleration time using the average value of Vdot = 1.07 ft/sec^2 or • Tacc = (180-167)*1.689/ 1.14 = 19.2 sec or 0.32 minutes 21-25
Design of UAV Systems c 2002 LM Corporation Air vehicle performance Turn performance • Typically two types of turn performance are of most interest - turn rate and time to turn(both instantaneous and sustained) • - Sustained turns are at constant speed (and altitude) • - Maximum sustained turn rate is at “corner speed”, the speed for LoDmax (See RayAD Fig 17.6) • - By definition Ta = D • - In instantaneous turns, speed (or altitude) can be lost • - Maximum turn rate is at Clmax or max g’s (Nz) • In a level turn (RayAD Fig 17.5) • L*cos() = W or = arccos(1/Nz) (21.14) • and d/dt = (g/V)*sqrt(Nz^2-1) (21.15) • where = bank angle and d/dt = turn rate • Time to turn = time to bank + turn angle () ÷ (d/dt) 21-26
Design of UAV Systems sensor field of regard incident border maximum rate turn sector assigned platform c 2002 LM Corporation Air vehicle performance UAV application • Although UCAVs eventually may have maneuver and dash requirements to allow them to operate with manned aircraft, UAVs currently do not • - In the future,however, we should anticipate UAV requirements on turn performance • - The requirements will probably be driven by platform reaction time, for example, to turn X degrees in Y seconds in order to position a sensor on a target • Consider a loitering UAV with a forward looking sensor, flying a race track pattern. 21-27
Design of UAV Systems sensor field of regard incident border maximum rate turn sector assigned platform c 2002 LM Corporation Air vehicle performance Example • We assume that an incident occurs when the UAV is looking directly away from it • - How long does it take for a 3 g, 180 kt UAV to put its sensor on target assuming a 30 degree field of regard, that is the UAV has to turn 150 degrees, assuming a roll rate of 30 degrees/second • From 21.14, = arccos(1/Nz) = = arccos(1/3) = 70.5 • - Time to bank = 70.5/30 = 2.4 seconds • - d/dt = (g/V)*sqrt(Nz^2-1) = (g/(180*1.689))*(9-1)^.5 = • 0.3 rad/sec = 17.15 deg/sec • Therefore, time to turn = 2.4 + 150/17.15 = 11.1 sec 30 deg 21-28
Design of UAV Systems c 2002 LM Corporation Air vehicle performance Descent and landing • For pre-concept design, mission rules typically give no range credit (and no fuel penalty) for descent • We will use this ground rule for pre-concept studies • For conceptual and preliminary design, glide (idle thrust) performance can be calculated at L/Dmax • Mission rules typically specify landing fuel reserves in terms of endurance plus a percentage of total fuel • For small UAVs we will use a 10% reserve (0.1*Wf) • For UAVs operating from manned airfields we will use one hour endurance (Ello = 1 hr) + 5% fuel (0.05*Wf) • Landing distance typically is about equal to takeoff • Specifying balanced field length for takeoff assures that landing requirements will not be critical • See RayAD 17.9 for landing analysis methodology 21-29
Design of UAV Systems c 2002 LM Corporation Air vehicle performance Example – cruise range • In order to calculate cruise range for the example TBProp UAV we need to know two (2) weights • 1. The weight at the beginning of cruise • - Which we assume is the weight at the end of climb • i.e. we ignore fuel required to accelerate from climb speed (167 kts) to cruise speed (180 kts) • 2. The weight at the end of cruise • Which we assume is equal to the weight at the beginning of the landing loiter • To calculate landing loiter weight, we work backwards from the landing weight (W19) which, by definition is empty weight + Wmisc + landing fuel reserves or • W19 = W0 – 0.95Wf = 1960 lbm • Which we assume is also the weight at the end of loiter 21-30
Design of UAV Systems c 2002 LM Corporation Air vehicle performance Landing loiter and final cruise • Best loiter speed at LoDmax = 25.8 and 1821 lbm (W18/Sref = 25) is 98 kts • - From Cllo(max) = .768 and q18 = 25/.768 = 32.5 psf or Mlo = 0.148 and Vlo = 98 kts • From the TBProp engine model, sea level TSFC at 98kts is 0.246 or LoD/SFC = 104.9 • The endurance requirement is 1 hour • - Fuel required (equation 21.11) is calculated at 17 lbm • - Weight at the start of loiter (W18) is 1838 lbm • Loiter range factor (RFl0) is calculated at 10783 nm • By our mission rules W17 = W18 • Working backward and forward we now have final and initial cruise weights 21-31
Design of UAV Systems c 2002 LM Corporation Air vehicle performance Cruise range • By definition cruise speed is 180 kts at 27.4 Kft • - W/Sref at the start of cruise = 2145/72.8 = 29.5 psf and L/D = 25.9 • - At the end of cruise W/Sref = 1838/72.8 = 25.2 psf and L/D = 23.0 • - TSFC at both conditions is 0.332 and average cruise range factor (RFcr) is 13679 nm • - Calculated cruise distance = 2109 nm • - Climb distance plus cruise distance = 2151 nm • Total cruise mission time (less landing loiter) = 11.7 • For our operating distance of 200 nm, about 10 hrs of operational loiter will be available vs. 12 hrs specified • - Fuel fraction, therefore, needs to increase, the air vehicle needs to be resized and all performance needs to be recalculated • This is why from this point on we will use spreadsheets to calculate weights, geometry and performance 21-32
Design of UAV Systems c 2002 LM Corporation Air vehicle performance Expectations • You should now understand • Parametric performance, range and endurance • Where they come from • How they are used • The limits of their applicability 21-33
Design of UAV Systems c 2002 LM Corporation Air vehicle performance Homework • Work your way through the example problems in this lesson and check/document the calculations (team grade) • Start taxi and takeoff fuel • Climb performance, fuel, time and distance • Acceleration performance • Turn performance • Landing loiter fuel • Cruise range • 2. Calculate initial start/taxi/takeoff fuel required; climb performance, fuel, time and distance; landing loiter and maximum cruise range for your design projects (individual grade) 21-34
Design of UAV Systems c 2002 LM Corporation Air vehicle performance Intermission 21-34