Download
1 / 107
1.07k likes | 1.29k Vues
OSBI Consulting. Summary of Key Findings and Implications 26 th February 2004. The Team . Christina Donovan Samant Sharma Jonathon Teesdale Nalin Singla. Overview. Data. Processing. Relative performance Overall Results Analysis for each manager

E N D
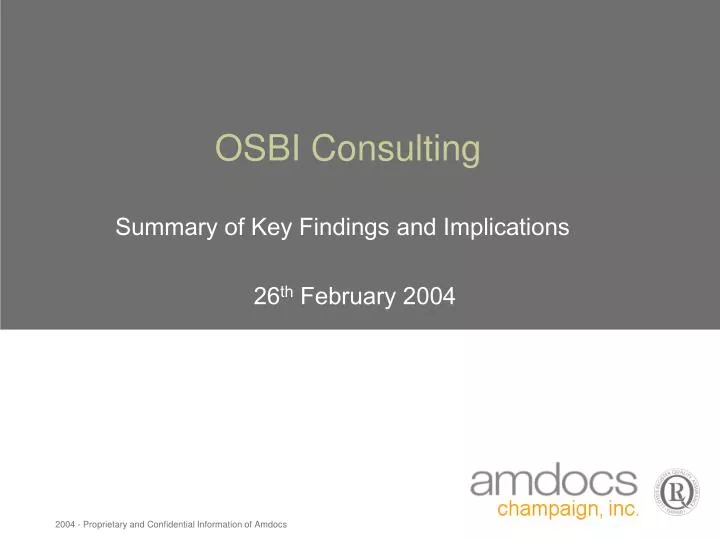
OSBI Consulting Summary of Key Findings and Implications 26th February 2004
The Team Christina Donovan Samant Sharma Jonathon Teesdale Nalin Singla
Overview Data Processing Relative performance Overall Results Analysis for each manager Qualitative analysis Information 267 Surveys 10 Managers 10 Departments 6 Categories Focus Groups Combining Coding SPSS Category Averages Categories
Summary of Findings (Quantitative Data) • Areas of Improvement : • Senior managerial performance and managerial performance • Motivating and praising employees • Work environment (listening to employees) • Good compensation and benefits • Employee empowerment • Improved quality of communication • Areas of Concern: • Lack of voice (including employees in planning and implementation of changes) • Communication of career and development opportunities • Favoritism in the workplace; perceived glass ceiling • A lot of neutral responses • Negative sense of caring for employees’ well-being
Categorization • SixCategories • Senior Managerial Performance • Managerial Performance • Work Environment • Quality of Communication • Meaningfulness and Investments • Compensation & Benefits • Focus Group
Statistics - Over All Distribution of surveys taken
Statistics - Over All • Rate your overall morale on the job at Amdocs Champaign • Low: 17%, Neutral: 39%, High: 44%
Statistics - Over All • How does your morale today compare to your morale a year ago (if applicable) • Low: 24%, Neutral: 32%, High: 44%
Statistics - Over All • Quality of Communication • Low: 30%, Neutral: 40%, High: 30% • Low: 24%, Neutral: 35%, High: 41% • Compensation • Low: 36%, Neutral: 24%, High: 40% • Low: 27%, Neutral: 27%, High: 46% • Benefit Program • Low: 14%, Neutral: 18%, High: 68% • Low: 13%, Neutral: 17%, High: 69% • Year Ago • Today
Statistics - Over All • Meaningfulness and Investment • Low: 25%, Neutral: 31%, High: 44% • Low: 20%, Neutral: 29%, High: 51% • Senior Managerial Performance • Low: 25%, Neutral: 38%, High: 37% • Low: 20%, Neutral: 33%, High: 46% • Year Ago • Today
Statistics - Over All • Managerial Performance • Low: 27%, Neutral:29%, High:44% • Low: 22%, Neutral:26%, High:52% • Work Environment • Low: 33%, Neutral:34%, High:33% • Low: 29%, Neutral:30%, High:41% • Year Ago • Today
Focus Group • Excessive Work Hours • 54% last year, 35% this year • Lack of respect for personal time • 45% last year, 34% this year • Lack of an effective escalation process • 35% last year, 23% this year • Company is recognizing wrong things (like hours worked) • 54% last year, 47% this year • Chaotic Environment and Poor Planning • 57% last year, 47% this year
Biggest Improvements in the Previous Year • Communication from above has increased • Less work hours, less stress • Standardization of processes (ISO) • General morale increase • Increase in management’s attentiveness to employee's needs • Introduction of leveling and career paths
Areas of Concern for the Coming Year • Lack of voice (including employees in planning and implementation of changes) • Communication of career and development opportunities • Favoritism in the workplace; perceived glass ceiling • General apathy • Negative sense of caring for employees’ well-being • Continuing the trend of improvement
Comments for Yossi Raveh • Top 5 areas of concern • Decrease favoritism & cultural tension issues. • Employee want more perks & social instruments. • Lessen work hours and give more respect for personal time. • Promote better communication across departments and hierarchies. • Improve training quality & consistency for employees and managers. • Other Recommendations • Re-evaluate the review process and system. • Create more clearly defined work procedures. • Improve employee appreciation and awards. • Increase face time with employees. • Bring back All-Hands meetings. • Improve product process and quality and bring in more projects. • Decrease management levels & look into complaints about management.
Comments for Dov Baharav • Opportunities for Improvement: • Information Flow • Most people do not have any idea bout Dov • Want Bell curve to be removed( May not have been communicated properly) • Stock Option • More clients needed • Review “review System”
Comments for Lori Malatesta • Opportunities for Improvement: • Strictly punish non-friendly, non-professional behavior. • To make sure people respect each other at work place and not yell • Give employees in Amdocs some assurance of their future and trust. • Strive for improved benefits and conditions for working moms • Process green cards for the people who are left behind. • Recruit based only on skill and give importance to any resume that comes from any employee, not just resumes from Managers. • Closing cultural gap. • House/vehicle loans with free or very normal interest rate. • Have one on one sessions with TL, PL, and PM to get a real picture of the work environment. • Mandatory training for managers on handling disciplinary actions and motivation/leadership skills. • Avoid diplomatic answers
Naidu Strengths • Senior managerial performance went up moderately, especially the communication from upper management. • Managerial Performance went up moderately, especially team spirit and managers response to the employees • Work hours are much better and their weekends are respected • The focus groups show a very positive trend • Quality of communication has improved heavily • Work environment has improved • A positive trend in meaningfulness and Investment
Naidu Opportunities for Improvement • Employees feel that they are not heard • Promotion issues are not handled fairly • Compensation generally is the same with little positive inclination • Employees feel they are not a part of the Planning & Decision making process. • A downward trend in the growth & training opportunities provided • Employees do not find their job interesting enough • Employees feel that the managers are not fair • Meetings are not planned well and are ineffective • Employees feel there is a “glass-ceiling” in their career growth.
Naidu - Observations • Senior Managerial Performance: • My senior manger is concerned about and is attentive to my needs • (17% agree, 50% disagree) • I have a great deal of interest in Amdocs and its future • (63% agree, 15% disagree) • Quality of Communication: • Career & Development Opportunities • (29% agree, 31% disagree) • Employees in the department participate in the planning and implementation of changes affecting us • (16% agree, 38% disagree)
Naidu - Focus Group • Excessive Work Hours • 76% last year, 57% this year • Chaotic Environment • 71% last year, 39% this year • Non-essential disruptions • 62% last year, 47% this year • Lack of effective escalation process • 39% last year, 20% this year
Naidu - Focus Group • Expected to work Israeli time • 57% last year, 40% this year • Favoritism shown in employee decisions • 37% last year, 40% this year • Perceived glass ceiling on career growth • 45% last year, 51% this year
Avi Ashkenazi Strengths • Most categories went up strongly • Communication with employees strongly on the rise • Attentive to employee needs • Employees fairly happy with opportunities provided to use and further develop their skills • Employees feel strongly that they are being dealt with fairly and honestly and most importantly, with care. • Employees feel that they are getting recognition. • Employees feel that they are paid fairly
Avi Ashkenazi Opportunities for Improvement • People don’t feel too enthusiastic about the work environment • People feel that reviews and promotions are much fairer now
Avi Ashkenazi - Observations • Work Environment • Employee promotion issues are treated with fairness • (23% agree, 24% disagree) • Managerial Performance • I receive adequate attention and recognition from my manager • (50% agree, 23% disagree) • My manager is concerned about and is attentive to my needs • (52% agree, 28% disagree) • Senior Managerial Performance • My senior manager is concerned about and is attentive to my needs (28% improvement - swayed the most people from the neutral category here) • (58% agree, 16% disagree)
Avi Ashkenazi - Focus Group • Excessive Work Hours • 80% last year, 56% this year • Chaotic Environment • 80% last year, 52% this year • Favoritism shown in promotions • 35% last year, 12% this year • Non essential disruptions • 60% last year, 34% this year • Poor Planning • 80% last year, 76% this year • Company is recognizing wrong things(like hours worked) • 70% last year, 71% this year