Download
1 / 14
140 likes | 254 Vues
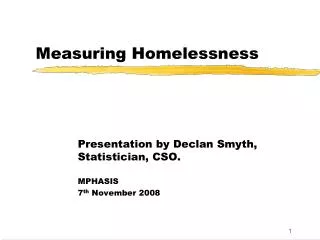
The FCM Quality of Life Reporting System Technical Report on Measuring Homelessness. Presentation to HRDC National Secretariat on Homelessness March 10, 2004. MUNICIPAL SURVEY Part A: Municipality Shelter Data. MUNICIPAL SURVEY Part B: Shelter Portion. MUNICIPAL SURVEY

E N D
The FCM Quality of LifeReporting SystemTechnical Report on Measuring Homelessness Presentation to HRDC National Secretariat on Homelessness March 10, 2004
MUNICIPAL SURVEY Part A: Municipality Shelter Data
MUNICIPAL SURVEY Part B: Shelter Portion
MUNICIPAL SURVEY Part B: Shelter Portion
EMERGENCY SHELTERS by type, 2002/2003
EMERGENCY SHELTER BEDS by type, All QOLRS, 91,96,01,02
SOCIAL HOUSNG WAITING LISTS Compared to total population - 02
SOCIAL HOUSING WAIT TIMES Average Wait Times (months), 02
RENTAL HOUSING STARTS as % all starts - 91,96,01
Families With Incomes Below the Low Income Cut Off - 91,96,01
VACANCY RATES 91,96,001
LONE PARENT FAMILIES as % all families- 91,96,001
Unemployment Rate ages 15+,91,96,01