Download
1 / 48
490 likes | 616 Vues
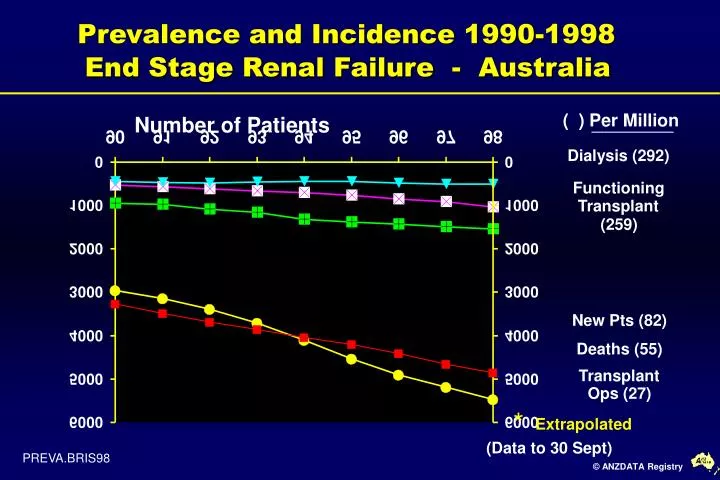
Prevalence and Incidence 1990-1998 End Stage Renal Failure - Australia. Number of Patients. ( ) Per Million. Dialysis (292). Functioning. Transplant. (259). New Pts (82). Deaths (55). Transplant. Ops (27). *. Extrapolated. (Data to 30 Sept). PREVA.BRIS98.

E N D
Prevalence and Incidence 1990-1998 End Stage Renal Failure - Australia Number of Patients ( ) Per Million Dialysis (292) Functioning Transplant (259) New Pts (82) Deaths (55) Transplant Ops (27) * Extrapolated (Data to 30 Sept) PREVA.BRIS98
Prevalence and Incidence 1990-1998End Stage Renal Failure - New Zealand Number of Patients ( ) Per Million Dialysis (295) Functioning Transplant (244) New Pts (93) Deaths (52) Transplant Ops (27) * Extrapolated (Data to 30 Sept) PREVZ.BRIS98
Annual Intake of New Patients 1994-1998 * Australia 1994 1995 1996 1997 1998 Number 1316 1385 1431 1486 1537 Per Million 74 77 78 80 82 Diabetic 17% 20% 19% 22% 23% Aboriginal 8% 8% 8% 10% 9% 55-64 yrs 277 314 309 309 311 65-74 yrs 341 334 411 398 391 75-84 yrs 71 102 117 136 175 Extrapolated (Data to 30 Sept) INTAKEA.BRIS98
Annual Intake of New Patients 1994-1998 * New Zealand 1994 1995 1996 1997 1998 Number 248 287 290 319 351 Per Million 69 78 78 85 93 Diabetic 38% 37% 36% 39% 49% Maori 33% 32% 33% 34% 36% Pacific Isl. 13% 13% 11% 8% 14% 55-64 yrs 70 73 72 79 105 65-74 yrs 39 46 55 69 79 75-84 yrs 2 10 6 11 13 Extrapolated (Data to 30 Sept) INTAKEZ.BRIS98
New Patients (Per Million) 1-Oct-97 to 30-Sep-98 Australia 82 (n=1544) New Zealand 89 (n=336) No. Pats. 264 526 419 31 99 51 154 NEWPTS.BRIS98
New Patients - Australia 1993 -1997Mean Patients Per Million Age Group Per Year Excluding Aboriginals and Analgesic Nephropathy 55-64 Yrs 65-74 Yrs Aust = 161 Aust = 236 QLDNSW VIC TAS SA NT WA QLD NSW VIC TAS SA NT WA States States
* Extrapolated (Data to 30 Sept) Acceptance of New Patients 1990-1998 * Age Specific Rates - Australia Patients Per Million AGESPECA.BRIS98
* Extrapolated (Data to 30 Sept) Acceptance of New Patients 1990-1998 * Age Specific Rates - New Zealand Patients Per Million AGESPECZ.BRIS98
Prevalence and Incidence 1990-1998Aboriginals - Australia Number of Patients ( ) Per Million Dialysis (1346) New Pts (392) Functioning Transplant (305) Deaths (218) Transplant Ops (84) * Extrapolated (Data to 30 Sept) ABORIG.BRIS98
* New Acceptances by RaceAustralia 1990-1998 Patients Per Million * Extrapolated (Data to 30 Sept) RACEA.BRIS98
New Acceptances by RaceNew Zealand 1990-1998 * Patients Per Million * Extrapolated (Data to 30 Sept) RACEZ.BRIS98
Prevalence and Incidence 1990-1998Maoris - New Zealand Number of Patients ( ) Per Million Dialysis (670) New Pts (223) Functioning Transplant (158) Deaths (118) Transplant Ops (26) * Extrapolated (Data to 30 Sept) MAORI.BRIS98
Prevalence and Incidence 1990-1998Pacific Islanders - New Zealand Number of Patients ( ) Per Million Dialysis (866) New Pts (241) Functioning Transplant (194) Deaths (111) Transplant Ops (32) * Extrapolated (Data to 30 Sept) PACISLAND.BRIS98
Patient Flow Diagram - Australia1-Oct-97 to 30-Sep-98 34 New Patients1510 5067 479 4585 1-Oct-97 DIALYSIS TRANSPLANT 5405 150 4820 30-Sep-98 Deaths 883 121
10 100 Patient Flow Diagram - New Zealand1-Oct-97 to 30-Sep-98 New Patients 326 993 851 1-Oct-97 DIALYSIS TRANSPLANT 1095 34 900 30-Sep-98 Deaths 174 24
Patient Flow Diagram - Queensland1-Oct-97 to 30-Sep-98 3 New Patients 261 791 96 917 1-Oct-97 DIALYSIS TRANSPLANT 831 23 974 30-Sep-98 Deaths 165 24
Patient Flow Diagram - New South Wales 1-Oct-97 to 30-Sep-98 8 New Patients 518 1959 148 1563 1-Oct-97 DIALYSIS TRANSPLANT 2051 47 1624 30-Sep-98 Deaths 337 44
Patient Flow Diagram - Victoria1-Oct-97 to 30-Sep-98 20 New Patients 399 1278 98 1096 1-Oct-97 DIALYSIS TRANSPLANT 1410 35 1157 30-Sep-98 Deaths 209 21
Patient Flow Diagram - Tasmania1-Oct-97 to 30-Sep-98 0 New Patients 31 107 14 97 1-Oct-97 DIALYSIS TRANSPLANT 106 2 106 30-Sep-98 Deaths 24 1
Patient Flow Diagram - South Australia1-Oct-97 to 30-Sep-98 3 New Patients 96 312 64 486 1-Oct-97 DIALYSIS TRANSPLANT 315 25 506 30-Sep-98 Deaths 53 20
Patient Flow Diagram - Northern Territory 1-Oct-97 to 30-Sep-98 0 New Patients 51 142 15 42 1-Oct-97 DIALYSIS TRANSPLANT 161 2 51 30-Sep-98 Deaths 18 1
Patient Flow Diagram - Western Australia 1-Oct-97 to 30-Sep-98 0 New Patients 154 478 44 384 1-Oct-97 DIALYSIS TRANSPLANT 531 16 402 30-Sep-98 Deaths 77 10
% PD New Patients Creatinine Clearance at EntryApril - Sept 1998 Australia Female (n=71) Female (n=198) Male (n=97) Male (n=337) % HD All Pts % 15 63 16 5 17 59 20 3
25-54 Yrs (n=228) 25-54 Yrs (n=57) 65-74 Yrs (n=129) 65-74 Yrs (n=44) % PD New Patients Creatinine Clearance at EntryApril - Sept 1998 Australia % HD
Diabetic (n=127) Diabetic (n=48) Other-No AN (n=382) Other-No AN (n=106) New Patients Creatinine Clearance at EntryApril - Sept 1998 Australia % HD % PD
% HD (n=535) % PD (n=168) New Patients Creatinine Clearance at EntryApril - Sept 1998 Australia
% HD % PD Early Start Treatment April - Sept 1998Proportion of New Patients with Creatinine Clearance 10 mls/min Australia Total HD 127 26 63 319 337 198 228 130 390 145 PD 48 10 18 88 97 71 55 44 145 23
% HD Australia 22 New Zealand 29 % PD 24 24 Early Start Treatment April - Sept 1998Proportion of New Patients with Creatinine Clearance 10 mls/min Total HD 78 176 164 6 39 19 56 PD 36 60 39 8 9 2 12
Blood Pressure Sept 1998 Australia • No gender difference • Haemodialysis pts slightly higher • Vascular diseases higher • Mean arterial pressure decreases with age • Higher pressure with “colour”
Cumulative Distribution of Blood Pressure Sept 1998 Australia Dias Sys 80 140
Mean Arterial Blood Pressure Dialysis Sept 1998 Australia 103 103 100 All HD PD
Median Systolic / Diastolic Blood Pressure DialysisSept 1998 Australia 150 Sys 145 140 Dia 80 80 80 All HD PD
Age, Blood Pressure and Dialysis Method Sept 1998 Australia <120 Syst >100 Diast >160 Syst % Pts
Erythropoietin Usage Australia Sept 1998 * Tas 62%
Erythropoietin Usage Australia Sept 1998 * 115 ) ** 284 ) not included due to lack of data return
1993 Aust 43% New Zealand 27% 1998 Aust 78% New Zealand 44% Proportion Patients Receiving Erythropoietin Sept 1998 HD % Pts
1993 Aust 21% New Zealand 9% 1998 Aust 61% New Zealand 23% Proportion Patients Receiving Erythropoietin Sept 1998 PD % Pts