Download
1 / 24
240 likes | 322 Vues
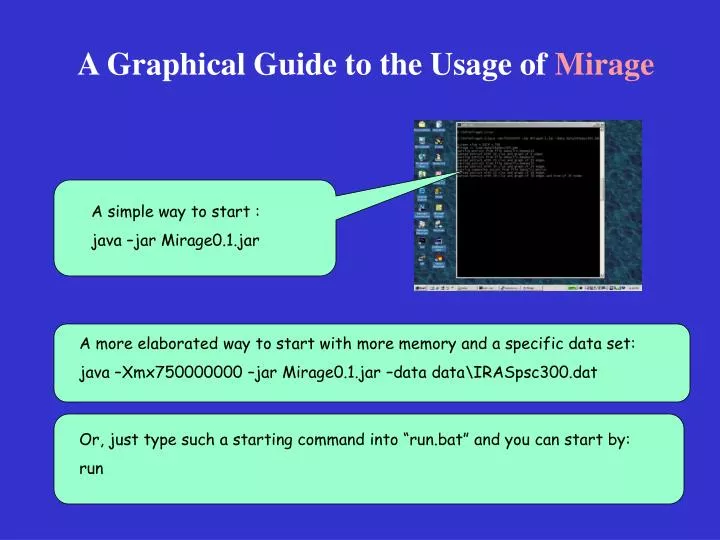
A Graphical Guide to the Usage of Mirage. A simple way to start : java –jar Mirage0.1.jar. A more elaborated way to start with more memory and a specific data set: java –Xmx750000000 –jar Mirage0.1.jar –data dataIRASpsc300.dat.

E N D
A Graphical Guide to the Usage of Mirage A simple way to start : java –jar Mirage0.1.jar A more elaborated way to start with more memory and a specific data set: java –Xmx750000000 –jar Mirage0.1.jar –data data\IRASpsc300.dat Or, just type such a starting command into “run.bat” and you can start by: run
Open a new data set, run a demo, print the full window, …or quit. The data matrix Go to other plots. What have been read from the file. The data matrix with one row for each entry and one column for each attribute. Rest the mouse on any button for a tool tip.
The histogram view Tools for making a selection. Click on one of these first, then draw on a plot to select. The box works for all plots, others only on some. Draw a range to select. Do something with your selection, say, bring them up as a table, color them, save in a cart, or broadcast to other plots.
Move the plotting range, zoom in/out, realign, fit to window The scatter plot Project the data to each pair of attributes in turn. Choosean attribute Changing the upper limit of x Rest the mouse over a location to read the coordinates.
The feature vector plot Show individual vectors, or only the selected ones, or ranges of values Show each data entry in turn. Choose from the vectors you defined with a format statement
Linked view of multiple plots A built-in page consisting of multiple types of plots. Choices of plots. Click on one of these and drag to overwrite an existing plot.
Selecting points in a plot Make a selection in a plot using the selection tools. Clear a selection. This toggles between making the intersection or union of subsequent selections.
Broadcasting a selection Then click on the antenna to broadcast to other plots. Until cleared, a selection remains effective despite changes of axes.
Coloring points permanently First make a selection. Then bring up the color chooser. Pick a color and then say OK.
Tracking colors in different views Now the color is everywhere … This changes a plot to color or monochromatic. Click on the desired button first, then click on the plot you want to change.
Coloring to mark classes Coloring is a way to mark classes of points. Heights are proportional to the fractions by class.
Walking in a histogram Walk through each bin in either direction. The highlights are automatically broadcasted.
Configuring new pages of plots Open a new page of plots, delete the top page, or renumber all pages. Choices of plots. Click on one of these and drag to an empty page, or drag to overwrite an existing plot. Use these to tile a new page as you wish.
Showing images Click to choose an image specified by a format statement. Drag the button to an empty window, or on top of an existing plot to overwrite.
Selecting areas in an image Select an image area with these tools to find the data objects bound to the included positions. This draws a Brezier curve … double click when the curve is good to terminate it. Broadcast to other plots to see their other attributes.
Seeing the same image in different resolutions and positions Rest the mouse somewhere to read the coordinates. Move an image, zoom in/out, realign with the window, or fit to window.
Making an array of the same type of plots Make an array of the same kind of plots. Set the layout of the array. Choose the type of plot.
An array of histograms Recall that you can walk in any one of them and see the echoes in others … Change between counts and percentages.
Displaying proximity structures Opens a partitional or hierarchical proximity structure. Choose a traversal order and click the arrow to step through it.
Exploring a hierarchical structure Knobs to open or close a branch of the tree. Highlight a cluster and show it in one of the basic views. Choose the view using these buttons.
Exploring a partitional structure Stops or restarts the layout relaxation. Leaf-to-leaf paths for traversal. Click to select a cluster and show its members in the basic views.
Walking in a cluster graph Walk along a chosen path to see its echoes in other views.
Commands and Command Menus Define new vectors, import images and structures, print a plot, export saved selections from the cart … Run simple clustering commands, and have the results automatically imported. Change properties of a plot, change dot sizes, curve widths, …first make a choice, then click on a plot to apply. Show run time messages Enter commands
Manual pages Data formats, commands, etc.