Download
1 / 21
210 likes | 307 Vues
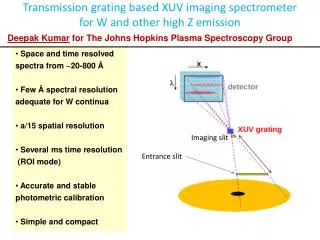
First results from Transmission Grating Imaging Spectrometer. D. Kumar, D. Stutman, K. Tritz, M. Finkenthal Plasma Spectroscopy Group, Department of Physics and Astronomy, The Johns Hopkins University. Device Setup. Motivation

E N D
First results from Transmission Grating Imaging Spectrometer D. Kumar, D. Stutman, K. Tritz, M. Finkenthal Plasma Spectroscopy Group, Department of Physics and Astronomy, The Johns Hopkins University.
Device Setup • Motivation • Provide impurity measurements for Multi-Energy Soft Xray system • Impurity monitor in itself • Detection • CsI coated MCP • Phosphor screen • CMOS imaging system
Device Setup • Design advantages • Survey spectrometer (30 A – 700 A) • Robust to neutrons • Provide spatial impurity distribution • Beam excited charge exchange emission • Electron excited emission (edge and core) • Frame exposure = 380 ms
Grating details • Free standing Grating dimensions • 1 mm x 1 mm • 200 nm period • NIST calibrations
Calibration through PID spectra Ne I 736 Ne II 461 A Al IV 161 A 24 A
Copper • No Copper observed. • Reason – The absence of Cu XIX doublet lines (2p63s – 2p63p) at 273 A and 303 A.
Molybdenum • 74 A Mo peak correlates with (Mn like Mo) • Some shots where DIM observed Mo • No LITER and strike points on LLD • However, no effect of Mo on Zeff • Data is noisy:
Lithium • Spatial profile of the ohmic spectrum at 135 A confirms that some Li does get into the plasma. • With NBI, the spatial profile indicates that there is something in addition to charge exchange.
Iron • Metals observed sometimes in the second frame when Pradrises.
Oxygen • MCP needs to be calibrated for proper calculations • From C VI 182 and O VIII 293 A: • From C VI 521 and O VIII 293 A: 2.5
Chlorine (SPRED) C IV 312 A Cl XV 237 A
Summary of Cl • The presence of 237 A Cl XIV along with Cl XV lines at 384 A and 415 A clearly confirms Cl • Cl emission substantially brighter with NBI • Cl seems to accumulate (towards core) with time • SPRED indicates presence of Cl at least since March 2007
Conclusion • Results – C, O, Cl, Li, Fe, Mo (?), Cu • Future direction • Geometric modeling • High speed readout • After run – Calibration of MCP efficiency
Acknowledgements • PPPL • L. Roquemore • R. Kaita • V. Soukhanovskii • C. Skinner • S. Gerhardt • G. Zimmer • NSTX 2nd shift – John, Jerry & Ron • VPL – Tommy • J. Winston • J. Dong • J. Wertenbaker • SSL, Berkeley • J. Lepson • NIST • C. Tarrio