Download
1 / 24
270 likes | 555 Vues
Lecture 3: Introducing Data Flow Diagrams (DFDs). Section 1 - The Concept of Diagrams Why use Diagrams? Diagrams as Working Documents Systems Analysis Modelling Techniques. Why Use Diagrams?. To help overcome the communication problem between users and developers.

E N D
Lecture 3:Introducing Data Flow Diagrams (DFDs) Section 1 - The Concept of Diagrams • Why use Diagrams? • Diagrams as Working Documents • Systems Analysis Modelling Techniques
Why Use Diagrams? • To help overcome the communication problem between users and developers. • Use of natural language, written or spoken open to • misinterpretation • ambiguities • omissions • Diagrams • help communication • help understanding • are unambiguous
Why Use Diagrams (Cont’d) DEVELOPERS (have discussions with users etc) CREATE DIAGRAMS (to record understanding) AMEND DIAGRAMS (with further information) USE DIAGRAMS as the BASE OF SYSTEM STRUCTURE
Diagrams as Working Documents • Diagrams are working documents: • changes will occur (for correctness) • changes must be documented and tracked • Change is integral to the development process.
Systems Analysis - Modelling Techniques (Examples) • Data Flow Diagrams • Entity Relationship Diagrams • Normalisation • Entity-Life Histories
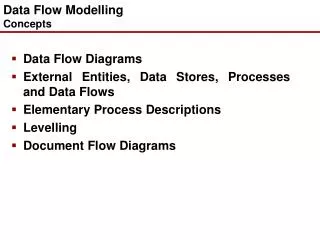
Lecture 3:Introducing Data Flow Diagrams (DFDs) Section 2 - Data Flow Diagrams (DFDs) • Data Flow Diagramming • DFD Notation • DFD Levelling • Guidelines for Drawing DFDs • Connectivity & Validation
Data Flow Diagramming • Business users normally define their business operation in terms of the processes of that operation. A process may be defined as an action or series of actions which produce a change or development. • The process view of a system may be modelled by a Data Flow Diagram (DFD).
Data Flow Diagramming (Cont’d) • DFDs concentrate upon the data needed to support the information requirements of a system: • what data is needed • the processes that convert it. • Data flow diagrams provide: • the notion of structure • static pieces of documentation • communication tool • DFDs are one of the most powerful and useful techniques available to the systems analyst.
DFD Notation A DFD has four key components. External Entity Process Data Store Data Flows
Processes • Processes are the individual tasks which when completed in a certain sequence fulfil the overall goal of the system of which they are a part. 2 Sales Clerk Validate Customer Order Processes transform input into output.
Data Flows • Data Flows depict the fact that some data in the form of documents, phone calls etc is moving. • From an external entity to a process (or vice versa). • From one process to another. • From a process to a store (or vice versa). invoice address
Data Flows (Cont’d) Write data to a file Take data from a file
Customer order 1 Sales Clerk Validate Order new_order part_number D1 Orders D2 Stock Data Flows (cont’d) • Data flow names should be different if the form of their data elements changes on entry to and exit from a process.
Data Stores D1 Stock • Data Stores contain data which is needed by a process in order for it to be completed. • These show data ‘at rest’ within the system. • They carry a description and are numbered D1, D2, D3 etc (computer data) or M1, M2, M3 etc (manual files).
External Entity Customer • External entities exist in the system’s environment and either provide data to the system (sources) or receive data from the system (sinks). • They are usually people, places, departments, organisations etc.
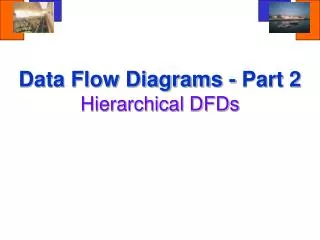
DFD Levelling • DFDs allow the analyst to look at the system at different levels of detail. • A business operation may contain many processes. • The inclusion of all processes on a single diagram can: • make it look cluttered • make it difficult to see exactly what a process does • To overcome this it is usual to ‘break down’ the diagram, a process known as levelling.
DFD Levelling (See Lejk & Deeks p67) Context Level 1 Level 2 1 2.1 External Entity Sub-process Process 2 2.2 Overall Process Sub-process Process 3 2.3 External Entity Sub-process Process
Context Diagrams (Overview or Level 0) • Represent the system at a high level of detail. Comprised of: • One single process box for the entire system. • External entities. • The data flows that pass between the external entities and the system.
Context Diagrams (cont’d) Purpose: • to identify and examine the interfaces between the external entities and the system.
Example Context Diagram Customer order Simple Order System invoice delivery_details Customer
Level 1 Diagrams Show: • the system in more detail • how data enters the system • how these data items are transformed by the processes • how they leave the system • A Level 1 diagram must have the same number of inputs and outputs as its context diagram. • The flows are connected to and from the actual processes which create, receive or change them. • Processes are numbered 1, 2, 3 etc on a Level 1 diagram.
Guidelines for Drawing a Context Diagram • Read the case study a number of times. • Try to list potential external entities. • Establish what flows are sent to the system from the external entities. • Establish what flows are sent from the system to the external entities. • Draw the Context diagram.
Guidelines for Drawing a Level 1 Diagram • Taking one sentence at a time try to identify potential processes (look for verbs). • Identify and list the data flows. • Identify and list the data stores. • Draw the Level one diagram (using the correct notation).
‘Connectivity & Validation’ • Make sure the Level 1 diagram is fully connected. • That is, a process must receive inputs from other processes or from data stores to be triggered. • Check the Level 1 diagram against the context diagram for consistency: • flows across the boundaries must be the same • names must be the same

![Data Flow Architectures EEE465 2001 Includes material from a lecture by Rick Kazman and Mary Shaw References: [Sha96] pp](https://cdn4.slideserve.com/182405/slide1-dt.jpg)