Download
1 / 40
400 likes | 552 Vues
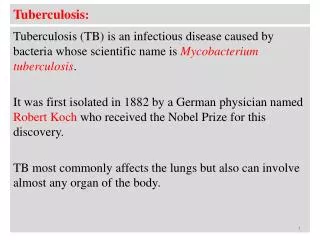
Tuberculosis Treatment: Challenge for the New Millennium. Jean B. Nachega, M.D., M.P.H. Research Associate Johns Hopkins University Center for Tuberculosis Research Baltimore, Maryland, USA. Global Status of TB.

E N D
Tuberculosis Treatment: Challenge for the New Millennium Jean B. Nachega, M.D., M.P.H. Research Associate Johns Hopkins University Center for Tuberculosis Research Baltimore, Maryland, USA
Global Status of TB TB is the second leading infectious cause of death in the world, after the Human Immunodeficiency Virus • 1/3 world population is infected with TB • In 1997, 8 million new cases of TB & rate of 136/100,000 • 3 million deaths per year • <40% of cases are reported to WHO • 24% of all preventable life-years lost annually due to TB Raviglione MC. Et al. JAMA 1995;273:220-6 WHO,Global TB Control: WHO Report 1999, Geneva, 1999, 179pp
Global Status of TB (Cont’d.) 80% of all cases worldwide occur in S S Africa & S E Asia • The biggest burden of TB is in SE Asia • ~3 million TB cases/year occur in S E Asia • ~3 million/year occur in SS Africa • Over a 1/4 of a million TB case/year occur in East Europe • Case and deaths are increasing in former Soviet Union Raviglione MC. Et al. JAMA 1995;273:220-6 WHO,Global TB Control: WHO Report 1999, Geneva, 1999, 179pp
Factors contributing to TB Prevalence/Incidence • HIV is contributing to large escalations in the global incidence of TB • HIV infection/MDR-TB • Poorly TB programs > lack of funding • Poor technology for diagnosing & Rx. TB • Urbanization and migration • Health sector reform/change • Harries AD., Lancet 1990; 335: 387-390
TB and HIV/AIDS TB is the leading killer of HIV/AIDS patients • Worldwide, 35 million people are HIV+ (~40-50% TB+) • 22% of all TB deaths occur in HIV-infected people • TB is the leading AIDS-related opportunistic infection • High rate of reactivation (10%/year) and primary TB • Risk of TB correlates with positive PPD & low CD4 Selwyn PA et al. JAMA, 1992; 268:504-9 Antonucci G. et al., JAMA, 1995; 274:143-8 Havlir D. and Barnes P., NEJM, 1999;340, 367
TB and HIV/AIDS: Copathogenicity • Mortality rate of TB/HIV+ patients is x4 Vs TB/HIV- • Immune activation from TB enhances systemic and local HIV replication • Change in HIV viral load is seen before and after TB Rx • TB is the leading AIDS-related opportunistic infection • Havlir DV ans Barnes PF., NEJM 1999, 340 (5) 367-73
TB and HIV/AIDS (Cont’d.) • Rare pulmonary cavitation (0-6%) • Increase extrapulmonary TB (40-70%) • Bacteremia & Nl Chest x-rays (10-22%) • Low Se. AFB smears from sputum (40-60%) • MDR-TB Chaisson RE and Slutkin G.,JID, 1989,159, (1), 96-100 Havlir D. and Barnes P., NEJM, 1999;340, 367
Effectiveness of TB Therapy in HIV infection Author Setting Reference Population Regimen Relapses Perriens et al. Zaire NEJM 1995; 332:779 HIV + HIV - IRZE2/IR4 IRZE6/IR6 IRZE2/IR4 8% 1% 5% Kassim et al.. Cote d’ivoire AIDS 1995; 9: 1185 HIV + HIV - IRZE2/IR4 IRZE2/IR4 3% 3% Chaisson et al. Haiti Am JR CritC Med 1996;154:1034 HIV + HIV - IRZE2/IR4, 3x/wk IRZE2/IR4 3x/wk 5% 3% USPHS RPT Trial Gr. United States Am JR Crit C Med 1998;157: A 467 HIV + IRZE2/IR4. 2x/wk or IRPT4 weekly 10%
WHO-IUATLD Global TB Drug Resistance Study: 1994-97 • 22 supranational laboratories • 35 participating centers • 50,000 TB patients • 20% of global population represented • Systematic sampling of new cases of TB • WHO/IUATLD Global Project on Anti-Tuberculosis Drug Resistance Surveillance, 1994-1997
WHO-IUATLD Global TB Drug Resistance Study: 1994-97 • Primary Drug Resistance: • Median: 10% Range: 2.0% -40.6% • Acquired Drug Resistance: • Median: 36% Range: 5.3%-100% • WHO/IUATLD Global Project on Anti-Tuberculosis Drug Resistance Surveillance, 1994-1997
M. Tuberculosis Drug Resistance Genes • INH: katG, inhA, kasA • RMP: rpoB • EMB: embA, embB, embC • PZA: pncA • SM: rrs, strA, rpoL • Zhang Y et al..1992,; 358:591-3 • Telenti A.et al.1993; Lancet 1993; 341: 647-50 • Sreevatsan S. et al. 1997; 41: 636-40.
The DOTS Strategy (WHO,1993) • DOTS is the best therapy against TB • (78-96% cure rate) • Directly Observed Treatment, • Short course
The DOTS Regimen (WHO,1993) DOTS is 6 month therapy • Intensive phase (daily, 2 mo) : INH, RMP, PZA, EMB • Continuation phase (3 times a week, 4 mo): INH & RMP
The DOTS Strategy (WHO,1993) • Combines five elements • Government commitment to TB Control • Microscopy services for diagnosis • Short course Rx (6mos)/ supervised 1st 2 mo • Drug supply • Recording/reporting system
Benefits of DOT(S) • Decrease rate of Rx failure/relapse • Prevent secondary spread • Decrease probability of drug resistance • Cost effective
The DOT Strategy (1980s) • Supervision of all doses of TB medication by a health team member • Directly Observed Treatment
TB in Baltimore, USA • Historically, the TB epicenter of the US • 1900s: William Osler, M.D.’s Campaign • 1902: Cases rates : 2,000/100,000 • 1930s: Highest TB cases and deaths rates • 1970: Mayor William Donald Schaeffer Chaulk P et al., 1995, JAMA, 274 (12), 945-51 Graham NM et al., Arch Internal Med 1996; 156:889-94
DOT in Baltimore, USA • 1973-88: Glasser D., M.D., DOT Concept • 1976-81: Clinic based DOT, 25% of all cases • 1980-92: Community DOT, 70% of all cases • 1993-Present: On average 90% of all cases Chaulk P et al., 1995, JAMA, 274 (12), 945-51 Graham NM et al., Arch Internal Med 1996; 156:889-94
DOT in Baltimore:Clinical Significance • 12 mo completion rate (CR) • CR: 90%/year in 1985-92 & 95-98% in ‘95-97 • Relapse rate: 2%-5%/year • Drug resistance very low: 0.05% Chaulk P et al., 1995, JAMA, 274 (12), 945-51 Graham NM et al., Arch Internal Med 1996; 156:889-94
DOT in Baltimore:Epidemiological Significance • 1978-95: 67% decrease TB incidence • 1978-92: City rate for TB fell from 2nd to 23rd Chaulk P et al., 1995, JAMA, 274 (12), 945-51
DOT in Baltimore:Political Significance • Sustained > 22 years /3 governors, 3 mayors • International endorsement • Effective DOT models patient-centered • Important role outreach, incentives, language • 1993: WHO introduces “DOTS” Chaulk P et al., 1995, JAMA, 274 (12), 945-51
TB in New York City, USA • 1982-90: Dramatic resurgence of TB • Mostly MDR-TB & attributable to HIV • Response: funding/surveillance/ control • Ext. use of DOT & preventive Rx in HIV+/PPD+ • Prevention of nosocomial transmission Frieden TR., et al. NEJM 1995; 333:229-233
Alternatives to DOT • Treatment Supervised by Family • Community Supervised Treatment • Intermittent Supervised Treatment
BRAC Program in Bangladesh (1984) • CHWs actively screen villages for chronic cough • Enrollment of patients with + sputum smears • Drug free of charge but 200 taka deposit • First 2 mo of CHWs supervised Rx • Weekly clinic visit for take home drug for 6 mo Mushtague A et al., Lancet 1997; 350: 169-72
Treatment Outcomes: BRAC TB Program Outcome 1992-94N=3497 1995N=68 1996 N=2729 1997N=1628 Cured *2833 (81%) 1301(85%) 2312(85%) 1463 (90%) Completed - 1(<1%) 6 (<1%) 0 (0%) Died 336 (10%) 126 (8%) 233 (9%) 99(6%) Failure 51(2%) 43 (3%) 52 (2%) 22 (1%) Defaulted & other 277(8%) 54 (4%) 126 (5%) 44 (3%) *Includes cured & completed cases Adapted from Mushtague A et al., Lancet 1997; 350: 169-72
Community DOT based program inHlabisa, South Africa: Results 1991-94 • 90% managed in community • > ½ supervised by non-Health Worker • Case holding by non-HW as good as by HW • 85% of surviving patients completed Rx • Cost of community Rx = cost of 5d in Hospital • Wilkinson D. et al., Am J Public Health, 1996; 86: 1094-97
Family Supervising TB Rx • 366 smear+ TB Patients 10/96-9/97 • Self selected supervised vs self administered Rx • Family member supervising most of the Rx • Overall cure rate: 80% • Supervised cure rate: 85% • Akkship et al. Int J TLD 1999; 3:1061-65
Effectiveness of TB Therapy in HIV infection Author Setting Reference Population Regimen Relapses Perriens et al. Zaire NEJM 1995; 332:779 HIV + HIV - IRZE2/IR4 IRZE6/IR6 IRZE2/IR4 8% 1% 5% Kassim et al.. Cote d’ivoire AIDS 1995; 9: 1185 HIV + HIV - IRZE2/IR4 IRZE2/IR4 3% 3% Chaisson et al. Haiti Am JR CritC Med 1996;154:1034 HIV + HIV - IRZE2/IR4, 3x/wk IRZE2/IR4 3x/wk 5% 3% USPHS RPT Trial Gr. United States Am JR Crit C Med 1998;157: A 467 HIV + IRZE2/IR4. 2x/wk or IRPT4 weekly 10%
Concurrent treatment of TB and HIV • Pansusceptible MTB, DOT at least 6 mo • Assess clinical and bacteriologic response, if non satisfactory longer course e.g. 9 mo is preferable • Pyridoxine 25-50 mg/d or 50-100 mg twice weekly for all HIV+ patients on INH • If RMP/RFB resistance, INH/EMB/PZA for a minimum of 18 mo (12 mo after culture conversion) • No PI or NNRTI in RMP containing regimen • Havlir DV ans Barnes PF., NEJM 1999, 340 (5) 367-73
Concurrent treatment of TB and HIV • NNRTI have diverse effects on CYP 450 • Nevirapine is an inducer, delaverdine an inhibitor and efavirenz both an inducer and an inhibitor • NRTI are not metabolized by CYP 450 • INH, EMB, PZA and SM are not CYP450 inducer and can be taken with all ARV drugs • Havlir DV ans Barnes PF., NEJM 1999, 340 (5) 367-73
Rates of TB in HIV+/PPD+ According to Rx Regimen Author Setting Reference Regimen Annual Rate RR Pape JW et al. Haiti Lancet ’93: 342:268 INH QD 12mo Vit. B6 (Placebo) 1.7% 10% 0.17 1 Whalen CC et al. Uganda NEJM ’97: 337(12),801 INH OD, 6mo INH/RIF QD 3mo INH/RIF/PZA QD 3mo Placebo 1.1% 1.3% 1.7% 3.4% 0.32 0.41) 0.42 1 Halsey NA. et al. Haiti Lancet ’98: 351:786 INH 2X/wk, 6mo RIF/PZA 2X/wk, 2mo 1.7 1.8 1 1.1 Mwinga A. et al. Zambia AIDS ’98: 12;2447 INH2X/wk, 6mo RIF/PZA 2X/W, 3mo Placebo 2.3 2.7 9.8 0.62 0.58 1
Treatment of Latent TB: INH Regimen • CDC now recommends at least 6 mo of INH • Therapy for 9 months appear sufficient • Therapy for >12 months does not provide additional protection • Daily regimen (300mg) or twice weekly (10-15 mg/kg up to 900mg)
Summary I • To date DOT(S) is the best Rx of TB • DOT(S) alone is not enough to control TB • Need for timely case finding and surveillance • Need for Screening & preventive Rx in high risk population (HIV, Household contacts)
Summary II • Prevention of institutional transmission • Integration of HIV/AIDS and TB prevention • Simplification of TB management • New drugs to overcome MDR-TB
A statistic is not just a number, it is a number with a teardrop on it Wade Hampton Frost, M.D.