Download
1 / 10
100 likes | 205 Vues
ECASA Steering Committee WP 2 Progress. Santiago de Compostela 18th june 2005. 1- List of indicators from Ecasa members. Aquaculture use of shoreline Minimum Oxygen Secchi measurements WQ in farms Fall of OM and macrofauna MU Fatty acid in the sediment Assets eutrophication assessment.

E N D
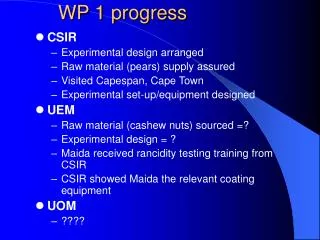
ECASA Steering CommitteeWP 2 Progress Santiago de Compostela 18th june 2005
1- List of indicatorsfrom Ecasa members • Aquaculture use of shoreline • Minimum Oxygen • Secchi measurements • WQ in farms • Fall of OM and macrofauna • MU Fatty acid in the sediment • Assets eutrophication assessment
Nutrients concentration • Phytoplankton and chlorophyll a • Chlorophyll a measurements • AMBI • Sulfate and ammonia Gradient • Trophic groups, macrofauna • Macrobenthic BFI • TOC • Nitrifiers • Sedimentation flux
DNA Damage indicators • MtDNA • EROD • Water availability • validated distance • Total phosphorus in sediment • Redox • Macrofauna • Macrofauna univariate
Output • Productivity • Employment • Profit • Damage costs • Multipliers • Producer prices • Consumers prices • See separate document for an extensive list
2- 34 indicators • macrofauna well considered • sediment • pelagic: chlorophyll mainly • other compartments are not proposed • spatial aspects are poorly considered • Socio economics are well addressed
3-Improvements • Data needed for indicator computation • References • Layman ’s lenguage explanations on the meaning are required • « indicator manual » for the toolbox • Considerations on assessment for use by WP4 are to be improved
Interactions with other WP • How to evaluate interactions between mariculture and environments from indicators and models? • To assess indicators and models is a common task. We need to organize it • Selecting indicators and models toolbox from operational view. What need to be tested?
Further Tasks for WP 2 • Reduce the number of overlapping indicators • Ecosystem approach indicators • Bibliography • WP Plan
Deliverables / Milestones • Report on the results of meeting on identifying and quantifying the indicators of the impact of aquaculture on environment D5 • annotated list of indicators, including specific formulae, field of application, and references. D7 • Report on the relevance of indicators to quantify the impacts of aquaculture on ecosystems. D10