Download
1 / 27
270 likes | 372 Vues
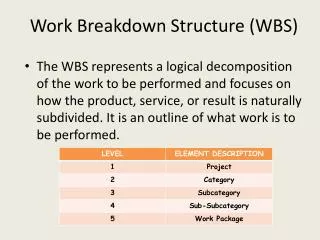
Comparison of breakdown behavior between klystron and beam driven structure. W. Farabolini With the support of J. Kovermann , B. Woolley, J. Tagg. Contents . Main test characteristics of TBTS vs. X-Box 1 BD locations BD precursor research BDR as function of RF power

E N D
Comparison of breakdown behavior between klystron and beam driven structure W. Farabolini With the support of J. Kovermann, B. Woolley, J. Tagg W. Farabolini
Contents • Main test characteristics of TBTS vs. X-Box 1 • BD locations • BD precursor research • BDR as function of RF power • BD distribution within time • BD ignition and transmitted RF falling time • Structure RF analysis after removal W. Farabolini
Typical RF signals Drive beam generated with PETS Klystron generated with pulse compressor • Pre-pulse • Quite stable pulse 24/7 • Great flexibility in pulse length and power • Triangular shape (recirculation) • Often instable pulse (and trips) • Pulse length and power not really flexible After-pulse in case of BD: reflected power perturbation on RF generator W. Farabolini
Stability of the RF power Many beam trips Two Beam Test Stand : beam generated power with RF recirculation Energy reduction after BD detection X-Box1 : Klystron generated power with pulse compression W. Farabolini
Data production • Total number of RF pulses • ACS 1 in TBTS about 3 millions (0.8 Hz repetition rate) • T24 : over 98 millions (50 Hz repetition rate) • TD24R05 : over 144 millions (4.3 millions per day max ) • Total number of BDs • ACS 1 in TBTS about 10000 (?) (10-2 < BDR < 10-3) • T24 : 3502 (BDR = 3.6 10-5) • TD24R05 : 7278 (BDR = 5.0 10-5) • Total number of 8 hours data log (about 40 Mbit each) processed • ACS1 in TBTS : few 10’ • T24 : 116 • TD24R05 : 228 W. Farabolini
T24 test condition summary Power ramping Pulse length to keep BDR around 10-5 Conditioning not achieved W. Farabolini
TD24R05 test condition summary Power and pulse length ramping strategy. (limit the available energy in case of BD) Full gradient 100 MV/m and pulse length 220 ns achieved with BDR = 10-5 W. Farabolini
BD location determination Reflected rising edge Transmitted falling edge time time time time • Edge detection is always tricky especially for the transmitted signal (BD ignition time) • Cross-correlation method is much more robust but possibly biased (needs strong and structured Reflected signal) 1st method Dtbetween Reflected rising edge and Transmitted falling edge • (BD start) Input falling edge Reflected falling edge 2ndmethod (echo) • Dt(correlation) between Input falling edge and Reflected falling edge • (BD end) W. Farabolini
Delays as function of cell # Effect of tapered cells Accuracy : 3.5 ns per cell (RF input side) / 7.5 ns per cell (RF output side) Sampling rate: 1 ns on TBTS, 4 ns on X-Box (log detector), but 1 ns available W. Farabolini
Hot spot at cell #6 in the 1st TBTS structure Ref -Trans method Ref –In method Evenness = 1 for equally distributed BDs Evenness = 0.66 Evenness = 0.33 W. Farabolini
No hot spot in the 2 present TBTS structures Present 2 ACSs in TBTS compilation Evenness = 0.96 Evenness = 0.95 W. Farabolini
T24 BD locations evolution in X-Box1 Hot cell(s) from the beginning Nota: possible positions absolute shift due to line delays uncalibrated W. Farabolini
TD24R05 BD locations evolution in X-Box1 Hot cell has appeared after 2 months W. Farabolini
Histogram of all BDs location (X-Box1) No BD in this cell ! T24 during 6 weeks Evenness_1st= 0.77 Evenness_2nd = 0.78 TD24R05 Feb. & Mar. Evenness_1st= 0.97 Evenness_2nd = 0.82 TD24R05 May. & Jun. Evenness_1st= 0.83 Evenness_2nd = 0.45 W. Farabolini
2 examples of 8 hours sequences • During BD cluster a hot cell (# 4 or # 5) appears • Blue marks show failures in BD location, often related to no current in FCU (red dots) W. Farabolini
A proposed diagnostic for BD location Franck Peauger– IRFU 2009 Segmented PMT rising time < 1 ns A. GrudievPlasma modelling in RF simulations, this WS RF output Additional passive or/and active diagnostics via damping waveguides RF input plasma • Possible to observe plasma oscillation Plasma ignited by the breakdown W. Farabolini
Research of precursors in FCU and Reflected RF peak values Motivation: Y. Ashkenazy, using stochastic theory for RF breakdown analysis, this WS Uncalibrated data • Faraday cup currents are negative (either dark current or BD burst). -1: saturated . • Reflected RF power are positive. • Background levels (offset) are suppressed. • All these signals are used to detect BDs and the 2 previous pulses are also data logged. W. Farabolini
Zoomed data from the 4th March Still no evidence of any precursor W. Farabolini
More subtle data processing to be applied RF signals Real BD Possible BD outside the structure Faraday cups signals (zoomed) Dark current only Burst of electrons • Look for power spectral density of the dark current (to be done) W. Farabolini
BDR as function of RF Power in TBTS But conditioning is still under progress W. Farabolini
BDR as function of Power (2) Upstream new ACS Previous ACS RF power density of Probability of all RF pulses (blue), of RF pulse with BD (red) and power law fit of BD probability (green) • Fitting the Power distribution when BD by a power law of the power distribution of all pulses provide an exponent between 12 and 18. W. Farabolini
Distribution of the number of RF pulses between BDs (clusters problem) • Inside clusters the BD probability becomes very high. • Discarding BDs within clusters allows to focus on the stationary BD statistics, well fitted by a Poisson law BD count evolution shows several period of intense BDs activity: clusters W. Farabolini
Ignition and falling edge duration Ignition Falling • Two categories of BDs : fast/slow ignition time • Mean ignition duration 40 ns Mean falling edge 50 ns (for commuting 50MW) Can it be related to neutrals and ions growth as shown by K. Sjobak , this WS ? W. Farabolini
Structure RF analysis after removal Jiaru Shi, analysis of T18 • R. Wegner found identical results for the 1st structure tested in TBTS • However cutting it with wire is delicate since activated (pb. of the TBTS) HFSS result: Iris deform 10um ~ 2MHz • Great interest in the “internal geometry measurement tool” presented by M. Aicheler, this WS W. Farabolini
Conclusion • Stand alone test stand provide a incredible capability of massive results production. • Fitting on of them with beam capability will be ideal. • BD theory / modeling and experimental activities can gain a lot in exchanging ideas and suggestions of tests. W. Farabolini
Typical RF signals during BDs in TBTS Ignition Exposure Falling • Transmitted falling edgeand Reflected rising edge supposed to be produced synchronously(ignition only absorbs power, not reflects) • Early BDs reflected power disrupts Input power (recirculation process in PETS) • Transmitted phase quite stable up to the falling edge (even during ignition) • Reflected phasecan drift or jump a lot (Input phase disruption and/or BD displacement?) W. Farabolini