Download
1 / 19
190 likes | 375 Vues
Response of the Arctic freshwater budget to extreme NAO forcing. How is the arctic freshwater budget connected to the NAO ? In this presentation: Repeat –NAO (1969) leads to the arctic retaining its freshwater in Beaufort gyre.

E N D
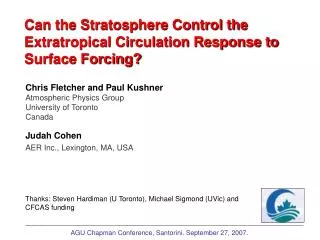
Response of the Arctic freshwater budget to extreme NAO forcing How is the arctic freshwater budget connected to the NAO ? In this presentation: Repeat –NAO (1969) leads to the arctic retaining its freshwater in Beaufort gyre. Repeat +NAO (1989) causes an export of freshwater from the Arctic to the North Atlantic. Main Arctic-Atlantic freshwater exports are via Canadian Archipelago and Fram Strait (50% and 30%). In +NAO forcing, the freshwater export from Fram and Canadian Archipelago to the North Atlantic increases by roughly the same amount (~650 km3/yr). Implications for Labrador Sea deep convection and climate prediction models that lack a Canadian Archipelago.
Model set-up • Run set-up • MITgcm simulation of the arctic using open boundary conditions from CUBE 49 (Uvel, Vvel, S,T) • Resolution: 210x192x50 (av. Horizontal resolution in arctic = 36 km) resolve sills and straits. • Initial SALT and THETA from Polar Hydrographic climatology (Steele et al.,) • PIOMAS (Pan-Arctic Ice-Ocean Modeling and Assimilation System ) sea ice distribution • NCEP daily forcing (Tair, 10m wind, precip, long/short wave, humidity) • No salinity restoring • 12 yr run 1992-2001. • RUNS • Control run (run13) 1992-2001 • NAO-high: as control, but repeat +NAO year 1989 wind field • NAO-low: as control, but repeat –NAO year 1969 wind field
Regional Model Domain ARCTIC MASK
NAO FORCING REPEAT FORCING OF EACH YEAR FOR 10 YEARS
ATMOSPHERE Precip = 2800 Evap=742 OCEAN Storage: Liquid: 66508 Trend: +308 Ice: 17778 Trend: -605 Total: 84284 Trend:-296 IN = 7399 OUT = 7744 Change = -345 Imbalance = -49 Bering = 2528 LAND Run-off Bering (ice) = 48 R = 2023 Canadian Arch. (Ice) = 1 Barents Sea = 664 Barents (Ice) = 258 Fram Strait (water) = 1396 Fram Strait (ice) = 2685 Canadian Arch. (Water) = 2000 CONTROL RUN (1992-2001 NCEP daily forcing)
NAO+ (11 yr repeat 1989) ATMOSPHERE Precip = 2800 Evap=749 OCEAN Storage: Liquid: 60338 Trend: -1000 Ice: 19521 Trend: -395 Total: 79859 Trend: -1395 IN = 7529 OUT = -9027 Change = -1497 Imbalance =-102 Bering = 2414 LAND Run-off Bering (ice) = 292 R = 2023 Canadian Arch. (Ice) = 143 Barents Sea = 597 Barents (Ice) = 201 Fram Strait (water) = 1489 Fram Strait (ice) = 3411 Canadian Arch. (Water) = 2436
NAO- (11 yr repeat 1969) ATMOSPHERE Precip = 2800 Evap=635 OCEAN Storage: Liquid: 68910 Trend: +604 Ice: 18523 Trend: -625 Total: 87433 Trend: -21 IN = 7352 OUT = 7350 Change = 2 Imbalance =+23 Bering = 2438 LAND Run-off Bering (ice) = 55 R = 2023 Canadian Arch. (Ice) = 37 Barents Sea = 537 Barents (Ice) = 224 Fram Strait (water) = 1745 Fram Strait (ice) = 2444 Canadian Arch. (Water) = 1766
OBSERVED (Serreze et al. 2006) ATMOSPHERE Precip = 3253 Evap=1299 OCEAN Storage: Liquid: 74345 Ice: 10449 Total: 84794 IN = 9494 OUT = 10372 Imbalance = -878 Bering = 2489 LAND Run-off Bering (ice) = N.A. R = 3000 Canadian Arch. (Ice) = N.A. Barents Sea = 340 Barents (Ice) = N.A. Fram Strait (water) = 2405 Fram Strait (ice) = 2265 Canadian Arch. (Water) = 3153
Total freshwater volume (liq+ice+snow) and ice movement (av. 2001) 1969 forcing 1989 forcing
-NAO +NAO CONTROL LIQUID ICE
-NAO +NAO CONTROL
-NAO +NAO CONTROL Fluxes
-NAO +NAO CONTROL
-NAO +NAO CONTROL
-NAO +NAO CONTROL
Atlantic Water penetration 1969 forcing 1989 forcing NAO+ increases the amount of warm, salty Atlantic Water in the Arctic
Next Step: The impact of a closed Canadian Archipelago on the freshwater budget, some what representative of coarse resolution models