Download
1 / 23
230 likes | 367 Vues
Local Health Department Financing: Findings from the 2005 National Profile of Local Health Departments Study. National Profile of Local Health Departments. Collaboration with CDC to collect data on local health department infrastructure Four National Profiles conducted to date

E N D
Local Health Department Financing:Findings from the 2005 National Profile of Local Health Departments Study
National Profile of Local Health Departments • Collaboration with CDC to collect data on local health department infrastructure • Four National Profiles conducted to date • Studies conducted in 1989, 1992-3, 1996-7, 2005 • Census design – includes all LHDs in U.S.
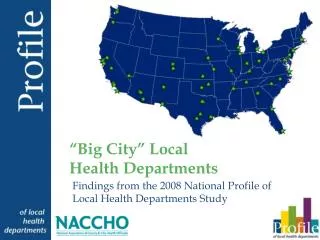
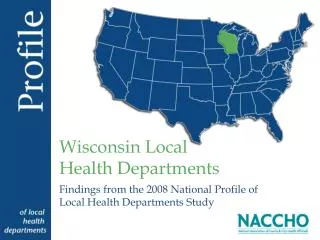
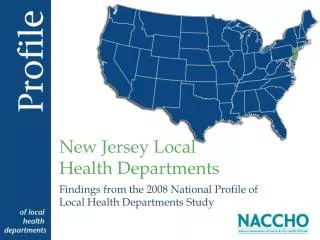
Governance Population served Finances Characteristics of top executive Workforce Activities and services provided Community health assessment & improvement Information technology Topics in 2005 Profile Core
Detailed information on: Finances Workforce Community health assessment & improvement Information technology Additional Topics: Performance improvement Emergency preparedness Partnerships Policy-making and advocacy Addressing health inequities Topics in Profile Modules
Financial Information in 2005 Profile Core questionnaire • Total annual expenditures (2 years) • Revenues sources (percentages of total) • CDC & HRSA emergency preparedness funding Module questionnaire • Changes in sources of revenue
LHDs Included in the 2005 National Profile Study (by State and Type of Governance)
Median Annual Per Capita LHD Expenditures(by LHD Characteristics)
Mean Percentage of LHD Revenues from Selected Sources (by Type of Governance)
For information on 2005 Profile study:Carolyn Leep, Senior AnalystNational Association of County & City Health Officialscleep@naccho.orghttp://www.naccho.org/topics/infrastructure/2005Profile.cfm