Download
1 / 68
680 likes | 690 Vues
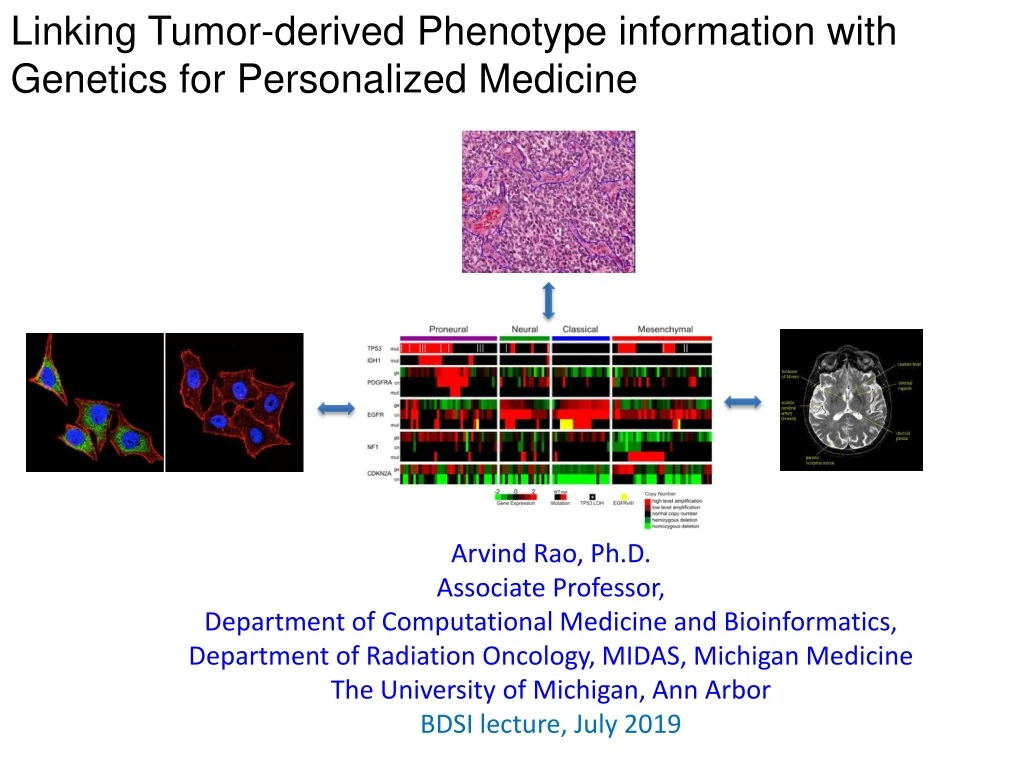
Linking Tumor-derived Phenotype information with Genetics for Personalized Medicine. Arvind Rao, Ph.D. Associate Professor, Department of Computational Medicine and Bioinformatics, Department of Radiation Oncology, MIDAS, Michigan Medicine The University of Michigan, Ann Arbor

E N D
Linking Tumor-derived Phenotype information with Genetics for Personalized Medicine Arvind Rao, Ph.D. Associate Professor, Department of Computational Medicine and Bioinformatics, Department of Radiation Oncology, MIDAS, Michigan Medicine The University of Michigan, Ann Arbor BDSI lecture, July 2019
Electrical Engineering Degree from India MSE, Electrical & Computer Engg, UT Austin Michigan AM Statistics IIDP PhD (EE: Systems and Bioinformatics), Focus: Transcriptional Regulatory Elements Carnegie Mellon: Lane Fellow of Computational Biology (Focus: image analysis) MD Anderson: Cancer Imaging and Bioinformatics Michigan Medicine: Bioinformatics and Radiation Oncology About me
Research Interests: Image Informatics Genomic Data Integration • Modeling Transcriptional Regulation • (ii) Infectious Disease Informatics • H&E images for Pathology • Immunofluorescence images for High Content Screening • Radiology data Build predictive statistical models that: (i) Correlateimage-derived (radiology/pathology) features with genomics or clinical outcomes (response etc.) (ii) Combine imaging and genomics data to predict outcome
Research Interests: Image Informatics Imaging Informatics for phenotyping (across cellular, histology and radiology) datasets Image Informatics cells RNAi in 2D/3D culture: high content screening tissue Radiogenomics: relate radiology with genomics in TCGA GBM Morphometric analysis for tissue sections organ
Cell: High Content Screening (drug screening to alter cancer phenotype) Organ: Facilitating Clinical Diagnosis (non-invasively grading tumor from radiology scans) Some Case Studies
Combine 2D/3D cell phenotypes with genetic vulnerabilities to prioritize drug combinations: TNBC
Case study: RNAi Screening + Drug Treatment Nano-coated Culture Plate siRNAs Assay for viability or projection formation Incubation for 48 hr Add drug and Incubation for 72 hr Transfection Reagent Add cells for Reverse-RNAi transfection X A. Image of 2D/3D assay results with MEKi B. Figure 1. A, Illustration of high throughput 3D siRNA screening assay. B, Captured image from 3D siRNA assay.
How Data is Organized 40 plates 10 plates each run: two untreated and two treated with a drug 96 wells/plate Each well corresponds to a pooled combination of genes (Kinome screen panel from Dharmacon)
Image phenotypes are in two categories: “no projection” or “long projection” Initial set of annotated instances: a list of 33 instances that were labeled “long”, “in between”, “with”, and “no” projections. no projections Long projections
Find genes whose knockdown produces a “no projection” phenotype in TNBC cell line These genes represent the “hits” Primary Purpose
Data analysis workflow Segmented entities (spheroids) of interest Image Analysis (pre-processing) Feature Extraction from images Data Mining - automatically scoring phenotypes (classification) Functional Analysis of hits (Ingenuity etc) “Hit” identification
Pre-processing, illustrated Background adjustment Contrast-stretching (histogram equalization/ matching)
Blob Segmentation Image features were obtained using the companion image-processing tool: InCell Developer2000 Blob: a spheroid or an aggregate of spheroids
Data analysis workflow Segmented entities (spheroids) of interest Image Analysis (pre-processing) Feature Extraction from images
Morphology features (area, form factor etc.) are better than intensity-based features [our experience] Are more robust Cross-validation can be used to assess robustness Which types of features?
Data (morphology/intensity features) is organized as a matrix (i) Each row represents an instance (field of a well) (ii) Each column is a set of features obtained over all cells in that field
Task: build classifier to discriminate “no projection” from “long projection” images Initial set of annotated instances: a list of 33 instances that were labeled “long”, “in between”, “with”, and “no” projections. no projections Long projections
Create an algorithm that can correctly label the un-annotated image into “long”/ “no projection” categories, based on the average morphological measurement from each image Morphology Classifier
One type of classifier: Decision trees http://commons.wikimedia.org/wiki/File:Decision_tree_model.png
Ensemble of decision trees Random forest classifiers
Trained classifier is used to annotate all the unlabeled data. Result: Images from wells corresponding to 351 distinct genes are found to induce “no projections” 351 genes no projections
Data analysis workflow Segmented entities (spheroids) of interest Image Analysis (pre-processing) Feature Extraction Data Mining - looking for groups (clustering) - automatically scoring phenotypes (classification) Functional Analysis of hits (Nextbio, Ingenuity etc) “Hit” identification
The genes underlying the two clusters are analyzed using the Ingenuity Pathway Analysis(IPA) software. The IPA tool aids in the examination of the relevant canonical pathways, gene ontology, and functional enrichment underlying an input set of genes. A brief summary of the top signaling pathways and biological functions as reported by the IPA software for the two clusters obtained from the affinity-propagation clustering step are reported. IPA – Ingenuity Pathway Analysis Reference for Image :www.galter.northwestern.edu
Leveraging User Feedback http://pages.cs.wisc.edu/~bsettles/pub/settles.activelearning.pdf
Round 1 no projection Long projection http://pages.cs.wisc.edu/~bsettles/pub/settles.activelearning.pdf
Round 2: Leverage User Feedback no projection Long projection Update http://pages.cs.wisc.edu/~bsettles/pub/settles.activelearning.pdf
Update Data, Build Model, Repeat • Advantages: • Much more resource aware • Converges faster compared to random data draws Keep doing this, until the model reaches some level of convergence
256 genes in the intersection correspond to the “no projection” phenotype So, the results of Round Two no projections 256 genes
In summary: Data analysis workflow Segmented entities (spheroids) of interest Image Analysis (pre-processing) Feature Extraction from images Data Mining - looking for groups (clustering) - automatically scoring phenotypes (classification) Functional Analysis of hits (Nextbio, Ingenuity etc) “Hit” identification
Background Triple-negative breast cancer (in which estrogen receptor, progesterone receptor, and HER2 are not overexpressed) • is characterized relatively poor prognosis, and metastatic behavior. • does not respond to receptor-targeted treatments such as hormonal therapy and trastuzumab, leaving chemotherapy as the mainstay of treatment • 6 different types: 2 basal-like (BL1 and BL2), an immunomodulatory (IM), mesenchymal (M), mesenchymal stem–like (MSL), and a luminal androgen receptor (LAR) subtype. Therefore, since current treatment modalities are inadequate for TNBC, it is important to develop new treatment strategies to inhibit tumorigenicity of TNBC. Objective • to identify potential targets that may enhance the anti-tumor activity of a AS703026 in TNBC Method • High-throughput 2D and 3D Kinome RNAi screening
Combine viability hits from 2D screens with morphology hits from 3D. 2D and 3D screens query different (non-overlapping) tumor hallmarks Combine 2D/3D screen results
Table 1. Gene lists that lead to no projection in the 3D screen.
Table 2. B, Summary of combinational index of AS703026 and XL765
C. AS703026 MDA-MB-231 SAR245409 Combination D. AS703026 SUM149 SAR245409 Combination
A. B. SUM149 MDA-MB-231 AS703026 + 0.50.5 - 0 0 + 0 0 + 0.50 + 0 0.5 Attractant - 0 0 + 0 0 + 0.50 + 0 0.5 + 0.50.5 Attractant SAR245409 AS703026 (μM) AS703026 (μM) SAR245409 (μM) SAR245409 (μM) Combination C. D. SUM149 MDA-MB-231 AS703026 Lee et.al, “High-throughput 2D/3D RNAi screening with MEK inhibitor, AS703026, to targeting Triple-negative breast cancer“ Intl J Cancer, 2015 Figure 4. Combination SAR245409
SYSTEMS IMAGING LABORATORY @ MDACC Acknowledgements BREAST MEDICAL ONCOLOGY @ MDACC • Dr. Naoto Ueno • Rachael Galloway • Priyanka Raja TxSACT: Texas Screening Alliance for Cancer Therapeutics GCC Chemical Genomics siRNA Screening FACILITY @ MDACC • Dr. Geoff Bartholomeusz • Justin Jacob
Cell: High Content Screening (drug screening to alter cancer phenotype) Organ: Facilitating Clinical Diagnosis (non-invasively grading tumor from radiology scans) Some Case Studies
Have you ever sneezed? ? ? Q: Patient presents with symptoms, who to treat with antibiotic?
The 1B$ Question: Who to treat? OR Which patient is likely to respond to Immunotherapy?
Glioblastoma (grade IV brain tumor) is strongly immunosuppressive Figure- Iba1 staining in human LGG and matched HGG samples in three different patients (400X). Note the significant increase in macrophage infiltration in HGG relative to LGG. Data from collaborator Dr. G Rao’slab. Figure: Landscape of expression variation in immunological gene-sets (from MSigDb and [Senbabaoglu, 2016]) within selected TCGA LGGs and HGG cases
Motivation: Assessing response to Checkpoint Inhibitors in GBM • Glioblastoma (grade IV brain tumor) is strongly immunosuppressive • Multiple checkpoint inhibitor trials are underway for GBM Preusser, M. et al. (2015) Prospects of immune checkpoint modulators in the treatment of glioblastoma Nat. Rev. Neurol. doi:10.1038/nrneurol.2015.139
Representative clinical trials of immune checkpoint inhibitors in glioblastoma and brain metastases Preusser, M. et al. (2015) Prospects of immune checkpoint modulators in the treatment of glioblastoma Nat. Rev. Neurol. doi:10.1038/nrneurol.2015.139
Multiple checkpoint inhibitor trials are underway for GBM • Also, in the Phase 0 setting: immunotherapy prior to surgery • Assessing the balance of tumor-mediated immunosuppression and immune effector activity might help determine how the tumor might respond to immunotherapeutics