Download
1 / 1
10 likes | 165 Vues
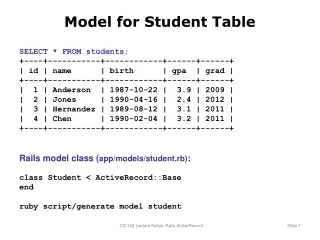
W-045. Fasting Glucose Model-Based Meta-Analysis: A Tool for Designing and Interpreting Early Diabetes Studies William S. Denney, Beesan Tan, and Gianluca Nucci Clinical Pharmacology, Pfizer PharmaTherapeutics R&D, Cambridge Laboratories, Pfizer Inc, Cambridge, MA 02139.

E N D
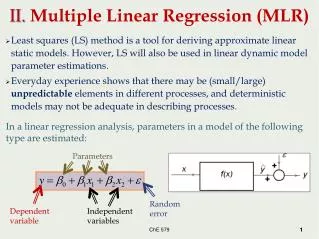
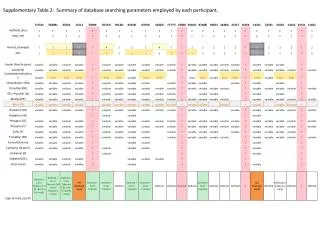
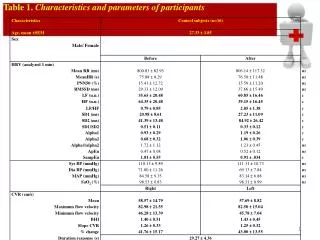
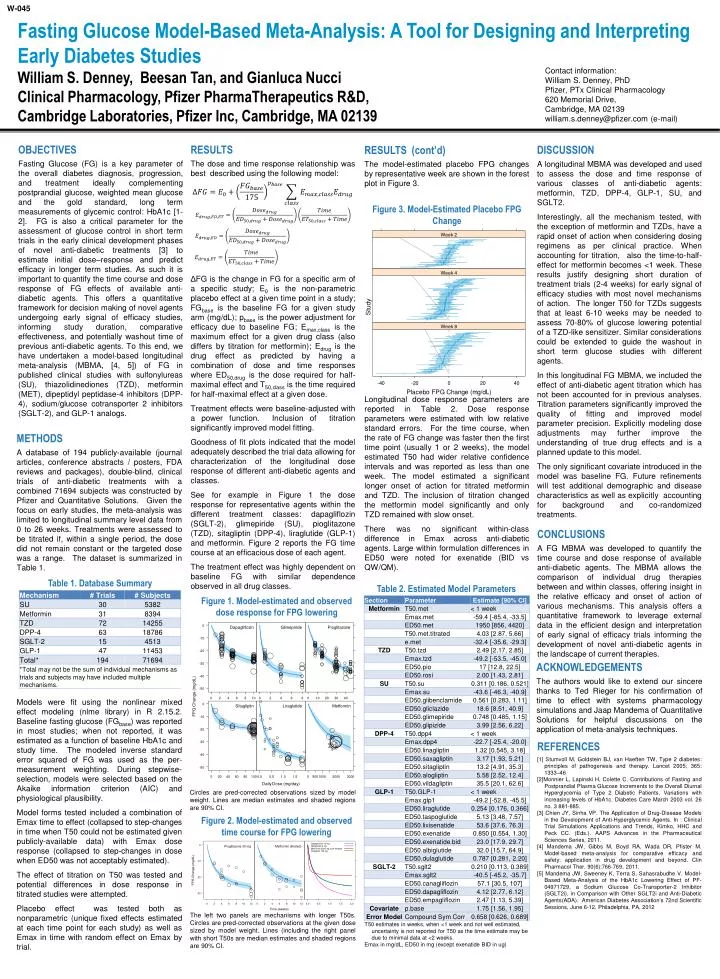
W-045 Fasting Glucose Model-Based Meta-Analysis: A Tool for Designing and Interpreting Early Diabetes Studies William S. Denney, Beesan Tan, and Gianluca Nucci Clinical Pharmacology, Pfizer PharmaTherapeutics R&D, Cambridge Laboratories, Pfizer Inc, Cambridge, MA 02139 Contact information: William S. Denney, PhD Pfizer, PTx Clinical Pharmacology 620 Memorial Drive, Cambridge, MA 02139 william.s.denney@pfizer.com (e-mail) OBJECTIVES Fasting Glucose (FG) is a key parameter of the overall diabetes diagnosis, progression, and treatment ideally complementing postprandial glucose, weighted mean glucose and the gold standard, long term measurements of glycemic control: HbA1c [1-2]. FG is also a critical parameter for the assessment of glucose control in short term trials in the early clinical development phases of novel anti-diabetic treatments [3] to estimate initial dose–response and predict efficacy in longer term studies. As such it is important to quantify the time course and dose response of FG effects of available anti-diabetic agents. This offers a quantitative framework for decision making of novel agents undergoing early signal of efficacy studies, informing study duration, comparative effectiveness, and potentially washout time of previous anti-diabetic agents. To this end, we have undertaken a model-based longitudinal meta-analysis (MBMA, [4, 5]) of FG in published clinical studies with sulfonylureas (SU), thiazolidinediones (TZD), metformin (MET), dipeptidyl peptidase-4 inhibitors (DPP-4), sodium/glucose cotransporter 2 inhibitors (SGLT-2), and GLP-1 analogs. RESULTS The dose and time response relationship was best described using the following model: ΔFG is the change in FG for a specific arm of a specific study; E0 is the non-parametric placebo effect at a given time point in a study; FGbase is the baseline FG for a given study arm (mg/dL); pbase is the power adjustment for efficacy due to baseline FG; Emax,class is the maximum effect for a given drug class (also differs by titration for metformin); Edrug is the drug effect as predicted by having a combination of dose and time responses where ED50,drug is the dose required for half-maximal effect and T50,class is the time required for half-maximal effect at a given dose. Treatment effects were baseline-adjusted with a power function. Inclusion of titration significantly improved model fitting. Goodness of fit plots indicated that the model adequately described the trial data allowing for characterization of the longitudinal dose response of different anti-diabetic agents and classes. See for example in Figure 1 the dose response for representative agents within the different treatment classes: dapagliflozin (SGLT-2), glimepiride (SU), pioglitazone (TZD), sitagliptin (DPP-4), liraglutide (GLP-1) and metformin. Figure 2 reports the FG time course at an efficacious dose of each agent. The treatment effect was highly dependent on baseline FG with similar dependence observed in all drug classes. DISCUSSION A longitudinal MBMA was developed and used to assess the dose and time response of various classes of anti-diabetic agents: metformin, TZD, DPP-4, GLP-1, SU, and SGLT2. Interestingly, all the mechanism tested, with the exception of metformin and TZDs, have a rapid onset of action when considering dosing regimens as per clinical practice. When accounting for titration, also the time-to-half-effect for metformin becomes <1 week. These results justify designing short duration of treatment trials (2-4 weeks) for early signal of efficacy studies with most novel mechanisms of action. The longer T50 for TZDs suggests that at least 6-10 weeks may be needed to assess 70-80% of glucose lowering potential of a TZD-like sensitizer. Similar considerations could be extended to guide the washout in short term glucose studies with different agents. In this longitudinal FG MBMA, we included the effect of anti-diabetic agent titration which has not been accounted for in previous analyses. Titration parameters significantly improved the quality of fitting and improved model parameter precision. Explicitly modeling dose adjustments may further improve the understanding of true drug effects and is a planned update to this model. The only significant covariate introduced in the model was baseline FG. Future refinements will test additional demographic and disease characteristics as well as explicitly accounting for background and co-randomized treatments. RESULTS (cont’d) The model-estimated placebo FPG changes by representative week are shown in the forest plot in Figure 3. Longitudinal dose response parameters are reported in Table 2. Dose response parameters were estimated with low relative standard errors. For the time course, when the rate of FG change was faster then the first time point (usually 1 or 2 weeks), the model estimated T50 had wider relative confidence intervals and was reported as less than one week. The model estimated a significant longer onset of action for titrated metformin and TZD. The inclusion of titration changed the metformin model significantly and only TZD remained with slow onset. There was no significant within-class difference in Emax across anti-diabetic agents. Large within formulation differences in ED50 were noted for exenatide (BID vs QW/QM). Figure 3. Model-Estimated Placebo FPG Change METHODS A database of 194 publicly-available (journal articles, conference abstracts / posters, FDA reviews and packages), double-blind, clinical trials of anti-diabetic treatments with a combined 71694 subjects was constructed by Pfizer and Quantitative Solutions. Given the focus on early studies, the meta-analysis was limited to longitudinal summary level data from 0 to 26 weeks. Treatments were assessed to be titrated if, within a single period, the dose did not remain constant or the targeted dose was a range. The dataset is summarized in Table 1. Models were fit using the nonlinear mixed effect modeling (nlme library) in R 2.15.2. Baseline fasting glucose (FGbase) was reported in most studies; when not reported, it was estimated as a function of baseline HbA1c and study time. The modeled inverse standard error squared of FG was used as the per-measurement weighting. During stepwise-selection, models were selected based on the Akaike information criterion (AIC) and physiological plausibility. Model forms tested included a combination of Emax time to effect (collapsed to step-changes in time when T50 could not be estimated given publicly-available data) with Emax dose response (collapsed to step-changes in dose when ED50 was not acceptably estimated). The effect of titration on T50 was tested and potential differences in dose response in titrated studies were attempted. Placebo effect was tested both as nonparametric (unique fixed effects estimated at each time point for each study) as well as Emax in time with random effect on Emax by trial. CONCLUSIONS A FG MBMA was developed to quantify the time course and dose response of available anti-diabetic agents. The MBMA allows the comparison of individual drug therapies between and within classes, offering insight in the relative efficacy and onset of action of various mechanisms. This analysis offers a quantitative framework to leverage external data in the efficient design and interpretation of early signal of efficacy trials informing the development of novel anti-diabetic agents in the landscape of current therapies. Table 1. Database Summary Table 2. Estimated Model Parameters Figure 1. Model-estimated and observed dose response for FPG lowering ACKNOWLEDGEMENTS The authors would like to extend our sincere thanks to Ted Rieger for his confirmation of time to effect with systems pharmacology simulations and Jaap Mandema of Quantitative Solutions for helpful discussions on the application of meta-analysis techniques. REFERENCES [1] Stumvoll M, Goldstein BJ, van Haeften TW, Type 2 diabetes: principles of pathogenesis and therapy. Lancet 2005; 365: 1333–46 [2]Monnier L, Lapinski H, Colette C. Contributions of Fasting and Postprandial Plasma Glucose Increments to the Overall Diurnal Hyperglycemia of Type 2 Diabetic Patients. Variations with increasing levels of HbA1c. Diabetes Care March 2003 vol. 26 no. 3 881-885. [3] ChienJY, Sinha VP. The Application of Drug-Disease Models in the Development of Anti-Hyperglycemic Agents. In : Clinical Trial Simulations Applications and Trends, Kimko, HHC and Peck CC. (Eds.). AAPS Advances in the Pharmaceutical Sciences Series, 2011. [4] MandemaJW, Gibbs M, Boyd RA, Wada DR, Pfister M. Model-based meta-analysis for comparative efficacy and safety: application in drug development and beyond. Clin PharmacolTher. 90(6):766-769, 2011. [5] MandemaJW, Sweeney K, Terra S, Sahasrabudhe V. Model-Based Meta-Analysis of the HbA1c Lowering Effect of PF-04971729, a Sodium Glucose Co-Transporter-2 Inhibitor (SGLT2i), in Comparison with Other SGLT2i and Anti-Diabetic Agents(ADA). American Diabetes Association’s 72nd Scientific Sessions, June 6-12, Philadelphia, PA, 2012 Circles are pred-corrected observations sized by model weight. Lines are median estimates and shaded regions are 90% CI. Figure 2. Model-estimated and observed time course for FPG lowering The left two panels are mechanisms with longer T50s. Circles are pred-corrected observations at the given dose sized by model weight. Lines (including the right panel with short T50s are median estimates and shaded regions are 90% CI.