Download
1 / 33
330 likes | 402 Vues
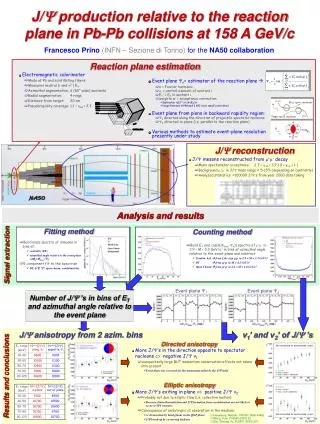
Long-Range Correlations in PbPb collisions at 158 A*GeV.

E N D
Long-Range Correlations in PbPb collisions at 158 A*GeV C.~Alt{9}, T.~Anticic{21}, B.~Baatar{8},D.~Barna{4}, J.~Bartke{6}, L.~Betev{9,10}, H.~Bia{\l}\-kowska{19}, A.~Billmeier{9}, C.~Blume{9}, B.~Boimska{19}, M.~Botje{1}, J.~Bracinik{3}, R.~Bramm{9}, R.~Brun{10},P.~Bun\v{c}i\'{c}{9,10}, V.~Cerny{3}, P.~Christakoglou{2}, O.~Chvala{15},J.G.~Cramer{17}, P.~Csat\'{o}{4}, N.~Darmenov{18}, A.~Dimitrov{18}, P.~Dinkelaker{9},V.~Eckardt{14}, G.~Farantatos{2}, D.~Flierl{9}, Z.~Fodor{4}, P.~Foka{7}, P.~Freund{14}, V.~Friese{7}, J.~G\'{a}l{4}, M.~Ga\'zdzicki{9,12}, G.~Georgopoulos{2}, E.~G{\l}adysz{6}, K.~Grebieszkow{20}, S.~Hegyi{4}, C.~H\"{o}hne{13}, K.~Kadija{21}, A.~Karev{14}, M.~Kliemant{9}, S.~Kniege{9}, V.I.~Kolesnikov{8}, T.~Kollegger{9}, E.~Kornas{6}, R.~Korus{12}, M.~Kowalski{6}, I.~Kraus{7}, M.~Kreps{3}, M.~van~Leeuwen{1}, P.~L\'{e}vai{4}, L.~Litov{18}, B.~Lungwitz{9}, M.~Makariev{18}, A.I.~Malakhov{8}, C.~Markert{7}, M.~Mateev{18}, B.W.~Mayes{11}, G.L.~Melkumov{8}, C.~Meurer{9}, A.~Mischke{7}, M.~Mitrovski{9}, J.~Moln\'{a}r{4}, S.~Mr\'owczy\'nski{12}, G.~P\'{a}lla{4}, A.D.~Panagiotou{2}, D.~Panayotov{18}, A.~Petridis{2}, M.~Pikna{3}, L.~Pinsky{11}, F.~P\"{u}hlhofer{13}, J.G.~Reid{17}, R.~Renfordt{9}, A.~Richard{9}, C.~Roland{5}, G.~Roland{5}, M.Rybczy\'nski{12}, A.~Rybicki{6,10}, A.~Sandoval{7}, H.~Sann{7}, N.~Schmitz{14}, P.~Seyboth{14}, F.~Sikl\'{e}r{4}, B.~Sitar{3}, E.~Skrzypczak{20}, G.~Stefanek{12}, R.~Stock{9}, H.~Str\"{o}bele{9}, T.~Susa{21}, I.~Szentp\'{e}tery{4}, J.~Sziklai{4}, T.A.~Trainor{17}, V.~Trubnikov{20}, D.~Varga{4}, M.~Vassiliou{2}, G.I.~Veres{4,5}, G.~Vesztergombi{4}, D.~Vrani\'{c}{7}, A.~Wetzler{9}, Z.~W{\l}odarczyk{12} I.K.~Yoo{16}, J.~Zaranek{9}, J.~Zim\'{a}nyi{4} (NA49 Collaboration at CERN) and G.Feofilov, R.Kolevatov, V.Kondratiev, P.Naumenko, V.Vechernin (V.Fock Institute for Physics of Saint-Petersburg State University (SPbSU)) Presented by G,Feofilov (for NA49 Collaboration and SPbSU) ISHEPP-XVII, JINR,Dubna, 27 Sept.-02 Oct. 2004
CONTENT • Introduction. Motivation: Fusion of strings • Long range (LR) correlations. Experimental method. NA49 apparatus • Selection of events and tracks • Long Range Correlations - Minimum bias collisions • Determination of correlation coefficients: variations of the Eveto class windows . • Results of the event mixing. • Centrality dependence of long-range correlations • Systematic errors (the 1st estimates) . • Average values of multiplicity <n> and transverse momentum <p_t> vs. centrality • HIJING and String Fusion Model calculations of Long Range correlations for PbPb at 158 A*GeV • Discussion: negative and positive correlations • Conclusions
Introduction. Fusion of strings Studies are motivated by the predictions of string fusion model pointing at the possibility of observation of long-range correlations as a signature of the onset of a string fusion phenomenon at some critical string density values reached in the high energy nucleus-nucleus collisions. (M.Braun, C.Pajares)
Types of correlations: 1. nB-nF- the correlation between charged particle multiplicities in backward (B) and forward (F) rapidity windows (n-n correlation). 2. ptB-nF- the correlation between the event mean transverse momentum in the backward rapidity window and the charged particle multiplicity in the forward window (p_t-n correlation). 3. ptB-ptF- the correlation between the event mean transverse momenta in backward and forward rapidity windows. (pt-pt correlation). Usually, a linear regression in absolute variables is used , for example : The linear regression in scaled (normalized) variables: 4
Selection of regions of interest(intervals or ``windows'' in rapidity) The following criteria were used:(i) uniformity of the NA49 efficiency for p_t measurementsin a given window(ii) sufficient separation of windows in the rapidity space(see A.Capella)The following intervals in rapidity were selected to be named as the ``backward'' (-0.29, 0.33) and the "forward" (0.91, 2.0).
NA49 azimuth acceptance for negative particles (as example )
Conventional parameters used in the track selection of NA49 data Parameters used in the track selection: • Zfirst& <200\\ • IFlag&0\\ • NMP& < 30\\ • NFP/NPM 0.5-1.1\\ • b_x \ -1.2cm - +1.2cm\\ • b_y \ -0.7cm - +0.7cm\\ • p_t 0.005 GeV/c - 2.5 GeV/c\\ • Here • Zfirst - is z-coordinate of the 1st track point • IFlag=0 means selected events • NMP - number of found (measured) points along the track • NFP - number of potential points of the track • b_x - x-coordinate of the track in the vertex plane • b_y - y-coordinate of the track in the vertex plane • Also the following ratio was used for the cuts: NFP/NMP - ratio of found points to potential points per track
Event-cuts The events selection was performed with the usual set of assumptions: • concerning the primary vertex position, • Only the good quality events were registered that were marked by the trigger as: ``Iflag=0'' for all centrality classes. Vertex position should be within the following boundaries for all events and for all classes: • VertexX=-0.2 - 0.1 cm ; • VertexY=-0.1 - 0.2 cm; • VertexZ=-579.2;-579.65 cm.
Total about 129000 minimum bias events were used for the final analysis. All plots and analysis here were obtained by the object-oriented data analysis framework ROOT. Additionally to the minimum bias events we used also high statistics samples of 161000 events for the 1st class and 194000 events for the 2nd class ( MiniDST data std+-160GeV-central-00B run No 00B year 1996).
Long Range nn and pt-n correlationsMinimum bias PbPb collisions at 158 A*GeV
Pt-Pt and <n>-pt min bias correaltions Long Range pt-pt and n-ptcorrelationsMinimum bias PbPb collisionsat 158 A*GeV
Long-range correlation data obtained for minimum bias events:some intriguing features: 1) the linear dependence of <n_B>_{n_F} on n_F is observed only in the region of forward multiplicities up to the values of n_F about 210. 2) The ``plateau'' is observed at higher values of n_F 3) the dependence of <p_{tB}>_{n_F} on n_F is very close to linear only in the interval n_F defined as (50-210).The steep rise with multiplicity of <p_{tB}>_{n_F} starting from the values about 0.3 GeV/cis seen for the low-multiplicity events, 4) the ``plateau'' , or p_{tB} ``saturation'' at the level of about 0.36 GeV/c is observed at values of forward multiplicities n_F higher than 210 5) a complicated non-linear general behavior of <p_{tB}>_{p_{tF}} vs. p_{tF} dependence is observed This non-linear dependence of <p_{tB}>_{p_{tF}} on p_{tF} has the ``bump'‘ of <p_{tB}> that reaches about 0.35 GeV/c at the values of p_{tF} of about 0.35 GeV/c. This general nonlinear striking dependence for minimum bias events is observed for the 1st time. 6) results similar to 5) are obtained for n_B-p_{tF} correlations
Correlation coefficients – systematic errors The variations of the basic event and track selection criteria near the previously chosen values: • The following parameters defining quality of the track selection were varied: • b_x cuts value • b_y cuts value • Track NFP/NMP (ratio of found points to potential points of vertex tracks) • Track NMP - number of found (measured) points per track • Track p_t (upper) cuts (from 2.5 GeV/c -to 5.5 GeV/c) • Track Zfirst - Z-coordinate of the 1st track point • No sensitivity (within statistical error bars) was found for the variation of the Track Zfirst parameter and for the p_t cuts in the case of nn, pt-n and pt-pt correlations.
…systematic errors • …As to the other parameters, we found for the nn correlations: 1) delta=0.470-0.474=0.004 (about 1%) for the track bx variation 2) delta=0.470-0.4725=0.0025 (about 0,5%) for the track by variation 3) delta= 0.48-0.465=0.015 (about 3% ) for the {NFP/NMP} variation (correlations are smaller for better quality track selection - due to the general drop in multiplicity in this case 4) delta= 0.462-0.472=0.01 (about 2%) for the NMP variation (correlations are smaller for the larger number of points per track required (better quality track selection) OUR PRELIMINARY ROUGH ESTIMATE for n-n syst.error is 4% • As to the ptn correlations, the variations of the following parameters were done near the mean values: • bx - gives about 10% • by - about 1% • {NFP/NMP} - gives about 5% • Track NMP variation - gives about 1% OUR PRELIMINARY ROUGH ESTIMATE for pt-n syst.error is 11%
Determination of correlation coefficients:variations of the Eveto class windows • The impact parameter window size (Eveto energy data) was varied around the relevant central values for a given centrality class in order to study the effect of its influence on n-n, pt-pt and pt-n correlation coefficients. • We expected to reach some plateau in the correlation coefficients at the values of delta-Eveto windows that are comparable or below the intrinsic resolution of the Eveto calorimeter. Thus we can exclude the influence of the class width (in other words, the results for all classes are free from the class window size dependence and are defined bythe finite impact parameter resolution of zero degree calorimeter).
Centrality selection NA49 Eveto calorimeter spectra for spectator nucleons before and after all cuts applied (Eveto values are in GeV). Positions of the Eveto intervals selected for centrality analysis of long-range correlations are indicated by the vertical bars. The Eveto data sample defined by the events forming the "plateau" region of the correlation plots is also shown separately inside the 1st class ( see further). 6 classes are counted from left (the most central) – to right (peripheral)
Examples of long range correlations for the 1st centrality class(black dots – experimental data; open circles – the event mixing data)
Example of the pt-n correlation coefficients dependence on the Eveto calorimeter window size (high statistics data, 161000 events for the 1st centrality class) PRELIMINARY
Tables: correlation coefficients for absolute and for the normalized values of observables
RESULTS Long range forward-backward n-n (a), pt-n(b) and pt-pt(c) correlation coefficients vs. centrality class for PbPb collisions at \sqrt{s}=17.3 GeV (black dots). Errors shown are statistical. Event mixing results are shown by the open circles. Straight lines are to guide the eye.
Long range forward-backward pt-pt correlation coefficients vs. centrality class for PbPb collisions at \sqrt{s}=17.3 GeV (black dots). Errors shown are statistical. Event mixing results are shown by the open circles. Straight lines are to guide the eye
Long range forward-backward pt-n correlation coefficients (in GeV/c) vs. centrality class for PbPb collisions at \sqrt{s}=17.3 GeV Black squares , - experimental data (errors shown are statistical). Open circles - Results of string fusion model Stars - HIJING results for 3 fm impact parameter window Crosses -–HIJING results for 0.5 fm impact parameter window .Straight lines are to guide the eye.PRELIMINARY
NA49 Collaboration at CERN (List of institutes) • {1}NIKHEF, Amsterdam, Netherlands. \\ • {2}Department of Physics, University of Athens, Athens, Greece.\\ • {3}Comenius University, Bratislava, Slovakia.\\ • {4}KFKI Research Institute for Particle and Nuclear Physics, Budapest, Hungary.\\ • {5}MIT, Cambridge, USA.\\ • {6}Institute of Nuclear Physics, Cracow, Poland.\\ • {7}Gesellschaft f\"{u}r Schwerionenforschung (GSI), Darmstadt, Germany.\\ • {8}Joint Institute for Nuclear Research, Dubna, Russia.\\ • {9}Fachbereich Physik der Universit\"{a}t, Frankfurt, Germany.\\ • {10}CERN, Geneva, Switzerland.\\ • {11}University of Houston, Houston, TX, USA.\\ • {12}Institute of Physics \'Swi{\,e}tokrzyska Academy, Kielce, Poland.\\ • {13}Fachbereich Physik der Universit\"{a}t, Marburg, Germany.\\ • {14}Max-Planck-Institut f\"{u}r Physik, Munich, Germany.\\ • {15}Institute of Particle and Nuclear Physics, Charles University, Prague, Czech Republic.\\ • {16}Department of Physics, Pusan National University, Pusan, Republic of Korea.\\ • {17}Nuclear Physics Laboratory, University of Washington, Seattle, WA, USA.\\ • {18}Atomic Physics Department, Sofia University St. Kliment Ohridski, Sofia, Bulgaria.\\ • {19}Institute for Nuclear Studies, Warsaw, Poland.\\ • {20}Institute for Experimental Physics, University of Warsaw, Warsaw, Poland.\\ • {21}Rudjer Boskovic Institute, Zagreb, Croatia.\\
HIJING and String Fusion Model calculations of Long Range correlations for PbPb at 158 A*GeV
PbPb nn correlations (Min Bias)SMF calculations: …… NO FUSION; ------ FUSION
Long range forward-backward p_t-p_t correlations in minimum bias PbPb collisions at %vvv: \sqrt{s}=17.3 GeV. The average backward transverse momentum at fixed p_tF vs. values of p_{tF}. Points - experimental data. Dotted curve - are the results of the NO FUSION calculations (see text) Solid curve are the results of calculations in of the MC String Fusion Model
PbPb pt-n correlations (Min Bias)SMF calculations: …… NO FUSION; ------ FUSION
CONCLUSIONS • The majority of the observed peculiarities for the long range correlation coefficients were successfully analyzed in the framework of a string percolation model. • The analysis performed for the observables (multiplicity and mean p_t) measured in two separated rapidity intervals in PbPb collisions at 158 A*GeV manifests the presence of the long-range correlations in multi particle production. • These long range correlations are originated in any event by a presence of at least two types of particle emitting sources that are characterized by the different mean multiplicity and p_t, but coincide in the rapidity space. The last point appears to be very important for the experimental observation of the phenomenon. • The fluctuating mixture of these (two) sources is responsible - in the case of a string fusion hypothesis - for the general growth of the mean p_t of the backward particles vs. the multiplicity of charged particles emitted into the forward rapidity window that is observed for the minimum bias events study. • This fluctuating mixture is also responsible in case of the centrality dependence study for the positive correlation values observed in the peripheral collisions (due to the higher level of fluctuations in number of participants in this region). • ------------------------------------------
CONCLUSIONS (continued) : 5) The fixed number of participants, selected in PbPb collisions by narrowing the Eveto calorimeter window, accounts under the string fudion hypothessis for the negative values of the mean pt-n correlation coefficients observed for the 1st time in the central PbPb collisions at the SPS energies 6) The analysis of the long range correlations obtained in PbPb collisions at 160 A*GeV energy was done on the base of numerical and analytical calculations using the MC string percolation model and its simplified cellular analog as well as in the framework of standard HIGING model. 7) Results are favoring at present the hypothesis of the color strings fusion phenomenon, but more studies are needed, including experimental (at RHIC energies) and the additional theoretical analysis.
LRC: a general question WHY? (both for pp and AA) Causality requires that correlations –if they exist - of Long Range in rapidity between particles (A and B) detected in any type of collisions must be made very early: (A.Dumitru et al./ Nuclear Physics A 810 (2008) 91-108 ). X. ARTRU and G. MENNESS1ER, “STRING MODEL AND MULTIPRODUCTION”, Nuclear Physics B70 (1974) 93-115 33