Download
1 / 31
310 likes | 429 Vues
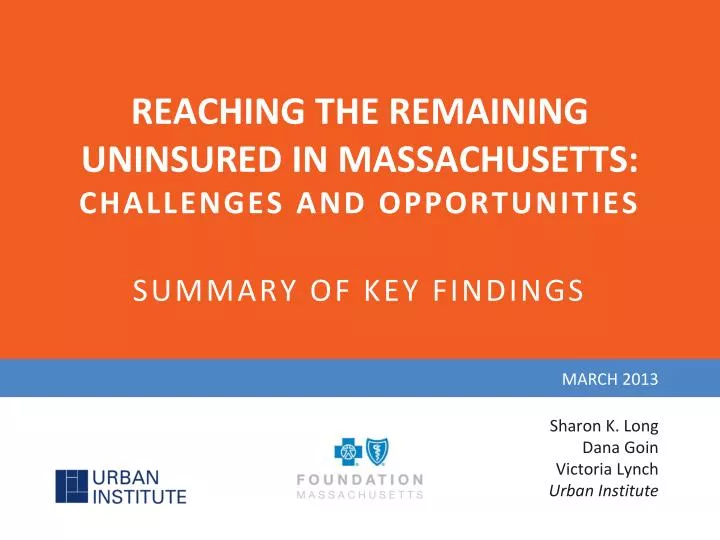
REACHING THE REMAINING UNINSURED IN MASSACHUSETTS: CHALLENGES AND OPPORTUNITIES SUMMARY OF KEY FINDINGS. MARCH 2013. Sharon K. Long Dana Goin Victoria Lynch Urban Institute. EXECUTIVE SUMMARY.

E N D
REACHING THE REMAINING UNINSURED IN MASSACHUSETTS: CHALLENGES AND OPPORTUNITIES SUMMARY OF KEY FINDINGS MARCH 2013 Sharon K. LongDana GoinVictoria LynchUrban Institute
EXECUTIVE SUMMARY In 2006, Massachusetts enacted an ambitious health care reform initiative, entitled An Act Providing Access To Affordable, Quality, Accountable Health Care, in a push toward near-universal coverage. Since implementation of these reforms, uninsurance in Massachusetts has declined significantly, with uninsurance in the state the lowest in the nation. Massachusetts’s low uninsurance rate reflects the effects of the individual mandate and expanded coverage options under reform, as well as an ongoing effort to bring the remaining uninsured into affordable coverage, particularly employer sponsored insurance. Since 2006, Massachusetts has invested more than $20 million in statewide outreach and enrollment efforts that have included both public and private initiatives. Massachusetts residents are once again facing changes in the available health insurance options, as implementation of national health reform begins under the Patient Protection and Affordable Care Act (ACA) of 2010. Continued outreach and enrollment efforts will be needed to explain the new coverage options available as the state moves forward with implementation of the ACA and to reach the remaining uninsured. This brief focuses on those lacking health insurance coverage in Massachusetts after the 2006 reform initiative, examining their insurance coverage over time and highlighting the difficulties they face in accessing and affording health care. Given that nearly all elderly persons are covered by the Medicare program, the focus here is on uninsured children and uninsured non-elderly adults in the state. Study findings suggest several strategies for reaching out to the remaining uninsured to further expand insurance coverage in Massachusetts. These would include initiatives targeted at uninsured individuals—younger adults, males, Hispanics, and those with language and, likely, literacy issues because of low educational attainment, as well as initiatives targeted at the communities in which high numbers of the uninsured individuals are residing. One group that will be particularly important to reach are the low-income uninsured workers who, because of an offer of coverage through their employer, are not currently eligible for Commonwealth Care but appear likely to be eligible for Medicaid as part of the ACA expansion. Targeting outreach strategies outside the health care system is also highly important, as many of the uninsured do not currently have a usual source of care and make limited use of health care services. With nearly all of the uninsured in families with income below 400% of the Federal Poverty Level (FPL), most will likely be eligible for Medicaid or subsidized coverage under the changes introduced with the ACA. Finally, given the greater concentration of uninsured persons in a small share of communities across the state, outreach efforts that target those specific communities could also be a useful strategy for reaching greater numbers of the uninsured. By combining geographic targeting with population targeting, there is the potential for particularly effective outreach efforts that focus on the needs of the uninsured individuals within the at-risk communities.
DATA AND METHODS DATA This study uses data from the Massachusetts Health Reform Survey (MHRS) and the American Community Survey (ACS). • MHRS.The MHRS relies on telephone interviews with a stratified, random sample of non-elderly working-age adults in Massachusetts, with oversamples of lower-income adults and uninsured adults. In 2010, the survey sample was modified to include both a landline telephone sample (comparable to that used in the survey for 2006 to 2009) and a random sample of cell phones. The decision to change the survey design to include both landline telephones and cell phones reflects the rapid increase in the share of cell-phone-only households over the last few years. The MHRS includes questions on insurance status; access to and use of health care; out-of-pocket health care costs and medical debt; insurance premiums and covered services (for those with insurance); health and disability status; and support for health reform. This study uses data from the 2008-2010 MHRS, providing data for 10,185 non-elderly adults in Massachusetts, including 1,128 uninsured non-elderly adults. The estimates are the average of data for the 2008 to 2010 period. • ACS. The ACS is conducted by the U.S. Census Bureau to provide information on the demographic, socioeconomic, and housing circumstances of U.S. residents. Of relevance to this project, a question on health insurance coverage was added to the survey in 2008. The ACS relies on an address-based sample frame and collects data using mail, phone, and in-person interviews continuously over the year. For this work, we rely on the 2010 ACS public use data files for the civilian non-institutionalized population.1 This provided data for 732,685 children and 1,796,679 non-elderly adults for the nation as a whole, with 14,873 children and 39,733 non-elderly adults in Massachusetts. The sample sizes for uninsured children and adults in Massachusetts were 208 and 1,900, respectively. METHODS The analyses of the MHRS and ACS rely on descriptive methods, comparing insured and uninsured non-elderly adults in Massachusetts for the MHRS analyses and comparing uninsured children and non-elderly adults in Massachusetts with their counterparts in the rest of the country in the ACS analyses. In both surveys, all estimates are weighted and control for the complex designs of the surveys. 1 For the ACS, we rely on the augmented public use data from the Integrated Public Use Microdata Series (IPUMS) to take advantage of edits that have been made to improve the use of the data for research. See Steven Ruggles, J. Trent Alexander, Katie Genadek, Ronald Goeken, Matthew B. Schroeder, and Matthew Sobek. 2010. Integrated Public Use Microdata Series: Version 5.0 [Machine-readable database]. Minneapolis, MN: University of Minnesota.
HEALTH INSURANCE COVERAGE AMONG NON-ELDERLY ADULTS 19 TO 64 IN MASSACHUSETTS, 2008-2010 PERCENT REPORTING INSURANCE STATUS • Health insurance coverage among non-elderly adults was quite high in Massachusetts over the 2008 to 2010 period, with 95.2% covered at the time of the survey and 89.4% continuously insured for the 12 months prior to the survey on average over the period. Insurance status at the time of the survey Insurance status at the time of the survey SOURCE:2008-2010 Massachusetts Health Reform Survey (MHRS).
AGE DISTRIBUTION OF INSURED AND UNINSURED NON-ELDERLY ADULTS 19 TO 64 IN MASSACHUSETTS, 2008-2010 PERCENT REPORTING CHARACTERISTIC • Non-elderly adults who were ever uninsured over the past 12 months tended to be younger than those insured for the full year, with over half of the uninsured under 35 years old. • Within the uninsured population, there was little difference in the age distribution of those uninsured for a year or more and the short-term uninsured (data not shown). SOURCE:2008-2010 Massachusetts Health Reform Survey (MHRS). * (**) (***) Significantly different from the insured at the 0.10 (0.05) (0.01) level.
GENDER DISTRIBUTION OF INSURED AND UNINSURED NON-ELDERLY ADULTS 19 TO 64 IN MASSACHUSETTS, 2008-2010 PERCENT REPORTING CHARACTERISTIC • Non-elderly adults who were ever uninsured over the past 12 months were more likely to be male than were those insured for the full year (62.5 versus 47.2%). • Within the uninsured population, those uninsured for a year or more were more likely to be male than were the short-term uninsured (79.1 versus 62.2%) (data not shown). SOURCE:2008-2010 Massachusetts Health Reform Survey (MHRS). * (**) (***) Significantly different from the insured at the 0.10 (0.05) (0.01) level.
MARITAL STATUS OF INSURED AND UNINSURED NON-ELDERLY ADULTS 19 TO 64 IN MASSACHUSETTS, 2008-2010 PERCENT REPORTING CHARACTERISTIC • Non-elderly adults who were ever uninsured over the past 12 months were less likely to be married (31.1 versus 60.4%) and more likely to be never married (43.9 versus 21.2%) than were those insured for the full year. • Within the uninsured population, those uninsured for a year or more were less likely to be married than were the short-term uninsured (22.8 versus 32.7%) (data not shown). SOURCE:2008-2010 Massachusetts Health Reform Survey (MHRS). * (**) (***) Significantly different from the insured at the 0.10 (0.05) (0.01) level.
FAMILY INCOME FOR INSURED AND UNINSURED NON-ELDERLY ADULTS 19 TO 64 IN MASSACHUSETTS, 2008-2010 PERCENT REPORTING INCOME LEVEL • Non-elderly adults who were ever uninsured over the past 12 months had much lower family income than did those insured for the full year, with nearly three-quarters below 300% of the Federal Poverty Level (FPL). • Within the uninsured population, those uninsured for a year or more were more likely to have incomes below the FPL than the short-term uninsured (30.2 versus 22.4%) (data not shown). • SOURCE:2008-2010 Massachusetts Health Reform Survey (MHRS). • NOTE:FPL is Federal Poverty Level. • * (**) (***) Significantly different from the insured at the 0.10 (0.05) (0.01) level.
EDUCATIONAL ATTAINMENT OF INSURED AND UNINSURED NON-ELDERLY ADULTS 19 TO 64 IN MASSACHUSETTS, 2008-2010 PERCENT REPORTING EDUCATION LEVEL • Non-elderly adults who were ever uninsured over the past 12 months were less likely to be college graduates than were those insured for the full year (23.1 versus 48.7%). • Within the uninsured population, those uninsured for a year or more were more likely to have less than a high school education than were the short-term uninsured (15.1 versus 6.5%) (data not shown). SOURCE:2008-2010 Massachusetts Health Reform Survey (MHRS). * (**) (***) Significantly different from the insured at the 0.10 (0.05) (0.01) level.
EMPLOYMENT STATUS OF INSURED AND UNINSURED NON-ELDERLY ADULTS 19 TO 64 IN MASSACHUSETTS, 2008-2010 PERCENT REPORTING WORK STATUS • Non-elderly adults who were ever uninsured over the past 12 months were less likely to be working than were those insured for the full year (40.8 versus 27.1%). • Within the uninsured population, those uninsured for a year or more were more likely to be working full-time than were the short-term uninsured (42.4 versus 30.9%) (data not shown). SOURCE:2008-2010 Massachusetts Health Reform Survey (MHRS). * (**) (***) Significantly different from the insured at the 0.10 (0.05) (0.01) level.
EMPLOYER INSURANCE OFFER, REASON FOR UNINSURANCE, AND PAYMENT OF PENALTY FOR BEING UNINSURED FOR SHORT- AND LONG-TERM UNINSURED NON-ELDERLY ADULTS 19 TO 64 IN MASSACHUSETTS, 2008-2010 PERCENT REPORTING STATUS • Relatively few of the uninsured non-elderly adults had an insurance offer from an employer, and many cited cost as the main reason for being uninsured. • The long-term uninsured were more likely than those uninsured for less than a year to have paid a penalty for being uninsured in the prior year (33.0 versus 7.7%). SOURCE:2008-2010 Massachusetts Health Reform Survey (MHRS). * (**) (***) Significantly different from the short-term uninsured at the 0.10 (0.05) (0.01) level.
USUAL SOURCE OF CARE AMONG INSURED AND UNINSURED NON-ELDERLY ADULTS 19 TO 64 IN MASSACHUSETTS, 2008-2010 PERCENT REPORTING STATUS • Non-elderly adults who were ever uninsured over the past 12 months were less likely to have a usual source of care than were those insured for the full year (68.1 versus 93.5%). • Within the uninsured population, those uninsured for a year or more were less likely to have a usual source of care than were the short-term uninsured (40.3 versus 71.8%) (data not shown). SOURCE:2008-2010 Massachusetts Health Reform Survey (MHRS). * (**) (***) Significantly different from the insured at the 0.10 (0.05) (0.01) level.
PLACE OF USUAL SOURCE OF CARE FOR INSURED AND UNINSURED NON-ELDERLY ADULTS 19 TO 64 IN MASSACHUSETTS WITH A USUAL SOURCE OF CARE, 2008-2010 PERCENT REPORTING STATUS • Among non-elderly adults with a usual source of care (USOC) those who were ever uninsured over the past 12 months were less likely to rely on a doctor’s office or private clinic as their USOC than were those insured for the full year (81.6 versus 62.2%). • Within the uninsured population, those uninsured for a year or more were less likely to rely on a doctor’s office or private clinic as their USOC than were the short-term uninsured (44.1 versus 62.4%) (data not shown). • SOURCE:2008-2010 Massachusetts Health Reform Survey (MHRS). • NOTE:USOC is usual source of care. • * (**) (***) Significantly different from the insured at the 0.10 (0.05) (0.01) level.
LENGTH OF RELATIONSHIP WITH USUAL SOURCE OF CARE FOR INSURED AND UNINSURED NON-ELDERLY ADULTS 19 TO 64 IN MASSACHUSETTS WITH A USUAL SOURCE OF CARE, 2008-2010 PERCENT REPORTING STATUS • Among non-elderly adults with a usual source of care (USOC), those who were ever uninsured over the past 12 months were less likely to have a long-term relationship with their provider (one year or more) than were those insured for the full year. • Within the uninsured population, there was little difference in the length of the relationship with their USOC for those uninsured for a year or more and the short-term uninsured (data not shown). • SOURCE:2008-2010 Massachusetts Health Reform Survey (MHRS). • NOTE:USOC is usual source of care. • * (**) (***) Significantly different from the insured at the 0.10 (0.05) (0.01) level.
HEALTH CARE USE IN THE PAST 12 MONTHS BY INSURED AND UNINSURED NON-ELDERLY ADULTS 19 TO 64 IN MASSACHUSETTS, 2008-2010 PERCENT REPORTING STATUS • Non-elderly adults who were ever uninsured over the past 12 months were less likely to have visited a general doctor, a specialist, or a dentist in the past 12 months than were those insured for the full year. • Within the uninsured population, those uninsured for a year or more were much less likely to have such visits than were the short-term uninsured (data not shown). SOURCE:2008-2010 Massachusetts Health Reform Survey (MHRS). * (**) (***) Significantly different from the insured at the 0.10 (0.05) (0.01) level.
EMERGENCY DEPARTMENT USE IN THE PAST 12 MONTHS BY INSURED AND UNINSURED NON-ELDERLY ADULTS 19 TO 64 IN MASSACHUSETTS, 2008-2010 PERCENT REPORTING STATUS • Non-elderly adults who were ever uninsured over the past 12 months were more likely to have visited the emergency department (ED), overall and for non-emergency care, in the last 12 months than were those with insurance for the full year (37.8 versus 32.0% and (17.9 versus 13.4%, respectively). • SOURCE:2008-2010 Massachusetts Health Reform Survey (MHRS). • NOTE:A non-emergency condition is one that the respondent thought could have been treated by a regular doctor if one had been available. • * (**) (***) Significantly different from the insured at the 0.10 (0.05) (0.01) level.
EMERGENCY DEPARTMENT USE IN THE PAST 12 MONTHS BY SHORT- AND LONG-TERM UNINSURED NON-ELDERLY ADULTS 19 TO 64 IN MASSACHUSETTS, 2008-2010 PERCENT REPORTING STATUS • Within the uninsured population, those uninsured for less than one year were more likely than the long-term uninsured to have visited the emergency department (ED) in the year prior to the survey (39.2 vs. 29.3 %). • SOURCE:2008-2010 Massachusetts Health Reform Survey (MHRS). • NOTE:A non-emergency condition is one that the respondent thought could have been treated by a regular doctor if one had been available. • * (**) (***) Significantly different from the short-term uninsured at the 0.10 (0.05) (0.01) level.
DIFFICULTIES ACCESSING CARE IN THE PAST 12 MONTHS BY INSURED AND UNINSURED NON-ELDERLY ADULTS 19 TO 64 IN MASSACHUSETTS, 2008-2010 PERCENT REPORTING STATUS • Non-elderly adults who were ever uninsured over the past 12 months were more likely to report problems accessing care than were those insured for the full year. • Within the uninsured population, those uninsured for less than a year reported more problems obtaining care than did the long-term uninsured, likely reflecting the disruptions associated with a loss of coverage (data not shown). • SOURCE:2008-2010 Massachusetts Health Reform Survey (MHRS). • * (**) (***) Significantly different from the insured at the 0.10 (0.05) (0.01) level.
ANY UNMET NEED FOR HEALTH CARE IN THE PAST 12 MONTHS AMONG INSURED AND UNINSURED NON-ELDERLY ADULTS 19 TO 64 IN MASSACHUSETTS, 2008-2010 PERCENT REPORTING STATUS • Non-elderly adults who were ever uninsured over the past 12 months were more likely to report not getting needed health care than were those insured for the full year. • Within the uninsured population, unmet need was similar for those uninsured for less than one year and the long-term uninsured. The one exception was for prescription drugs, with unmet need higher for the short-term uninsured (16.7 versus 10.0%) (data not shown). *** *** *** *** *** *** *** • SOURCE:2008-2010 Massachusetts Health Reform Survey (MHRS). • * (**) (***) Significantly different from the insured at the 0.10 (0.05) (0.01) level.
FINANCIAL BURDEN OF HEALTH CARE FOR INSURED AND UNINSURED NON-ELDERLY ADULTS 19 TO 64 IN MASSACHUSETTS, 2009-2010 PERCENT REPORTING STATUS • Non-elderly adults who were ever uninsured over the past 12 months were more likely to report financial difficulties and problems paying for health care than were those insured for the full year. • Within the uninsured population, the financial burden of health care was similar for those uninsured for less than one year and the long-term uninsured (data not shown). • SOURCE:2008-2010 Massachusetts Health Reform Survey (MHRS). • NOTE: The out-of-pocket spending measure is limited to adults with family income of less than 600% of the Federal Poverty Level, and is based on data from the 2010 MHRS. • * (**) (***) Significantly different from the insured at the 0.10 (0.05) (0.01) level.
UNMET NEED DUE TO COST IN THE PAST 12 MONTHS BY INSURED AND UNINSURED NON-ELDERLY ADULTS 19 TO 64 IN MASSACHUSETTS, 2008-2010 PERCENT REPORTING STATUS • Non-elderly adults who were ever uninsured over the past 12 months were more likely to report forgoing needed care due to cost than were those insured for the full year. • Within the uninsured population, unmet need due to cost was similar for those uninsured for less than one year and the long-term uninsured. The one exception was for prescription drugs, with unmet need higher for the short-term uninsured (14.8 versus 8.4%) (data not shown). *** *** *** *** *** *** *** • SOURCE:2008-2010 Massachusetts Health Reform Survey (MHRS). • * (**) (***) Significantly different from the insured at the 0.10 (0.05) (0.01) level.
CONFIDENCE IN ABILITY TO AFFORD HEALTH CARE IN THE FUTURE BY INSURED AND UNINSURED NON-ELDERLY ADULTS 19 TO 64 IN MASSACHUSETTS, 2010 PERCENT REPORTING STATUS • Non-elderly adults who were ever uninsured over the past 12 months were less confident in their ability to afford health care in the coming year than were those insured for the full year, with only 13.3% of the uninsured very confident as compared with36.3% very confident among the insured. • SOURCE:2010 Massachusetts Health Reform Survey (MHRS). • * (**) (***) Significantly different from the insured at the 0.10 (0.05) (0.01) level.
COMPARING MASSACHUSETTS WITH THE REST OF THE NATION: FAMILY INCOME OF UNINSURED NON-ELDERLY ADULTS 19 TO 64, 2010 PERCENT REPORTING INCOME LEVEL • Uninsured non-elderly adults in Massachusetts were more likely to live in higher income families than were the uninsured in the rest of the nation. • SOURCE:2010 American Community Survey (ACS). • NOTE:FPL is Federal Poverty Level. • * (**) (***) Significantly different from Massachusetts at the 0.10 (0.05) (0.01) level.
COMPARING MASSACHUSETTS WITH THE REST OF THE NATION: EDUCATIONAL ATTAINMENT OF UNINSURED NON-ELDERLY ADULTS 19 TO 64, 2010 PERCENT REPORTING EDUCATION LEVEL • Uninsured non-elderly adults in Massachusetts tended to have higher levels of educational attainment than did the uninsured in the rest of the nation. SOURCE:2010 American Community Survey (ACS). * (**) (***) Significantly different from Massachusetts at the 0.10 (0.05) (0.01) level.
COMPARING MASSACHUSETTS WITH THE REST OF THE NATION: AGE, SEX, AND MARITAL STATUS OF UNINSURED NON-ELDERLY ADULTS 19 TO 64, 2010 PERCENT REPORTING CHARACTERISTIC • Uninsured non-elderly adults in Massachusetts were more likely to be young, male and single than were the uninsured in the rest of the nation. • SOURCE:2010 American Community Survey (ACS). • * (**) (***) Significantly different from Massachusetts at the 0.10 (0.05) (0.01) level.
COMPARING MASSACHUSETTS WITH THE REST OF THE NATION: FAMILY TYPE OF UNINSURED CHILDREN 0 TO 18, 2010 PERCENT REPORTING CHARACTERISTIC • Uninsured children in Massachusetts were less likely to live in a two-parent, married family than were uninsured children in the rest of the nation. SOURCE:2010 American Community Survey (ACS). * (**) (***) Significantly different from Massachusetts at the 0.10 (0.05) (0.01) level.
COMPARING MASSACHUSETTS WITH THE REST OF THE NATION: FAMILY INCOME OF UNINSURED CHILDREN 0 TO 18, 2010 PERCENT REPORTING INCOME LEVEL • Uninsured children in Massachusetts were more likely to live in higher income families than were uninsured children in the rest of the nation. • SOURCE:2010 American Community Survey (ACS). • NOTE:FPL is Federal Poverty Level. • * (**) (***) Significantly different from Massachusetts at the 0.10 (0.05) (0.01) level.
UNINSURANCE RATE FOR CHILDREN AGE 0 TO 18 IN MASSACHUSETTS, 2010 • In 2010, uninsurance for children in Massachusetts was highest in pockets of the Western, Metro West, and Southeastern regions of the state. • The places in the state with the highest uninsurance rate for children over the 2008-2010 period were Revere (4.0%), Beverly (4.6%), Marlborough (4.9%), Framingham (4.9%), and Burlington (6.1%) (data not shown). • SOURCE:2010 American Community Survey (ACS).
NUMBER OF UNINSURED CHILDREN AGE 0 TO 18 IN MASSACHUSETTS, 2010 • In 2010, the highest numbers of uninsured children lived in parts of the Western, Metro West, and Northeastern regions of Massachusetts. • The places in the state with the highest numbers of uninsured children over the 2008-2010 period were Lynn (538), New Bedford (599), Brockton (657), Framingham (688), and Boston (1,659) (data not shown). • SOURCE:2010 American Community Survey (ACS).
UNINSURANCE RATE FOR NON-ELDERLY ADULTS 19 TO 64 IN MASSACHUSETTS, 2010 • In 2010, uninsurance among non-elderly adults in Massachusetts was highest in pockets of the Western, Southeastern, Northeastern, and Greater Boston area of the state. • The places in the state with the highest uninsurance rate for non-elderly adults over the 2008-2010 period were New Bedford (11.2%), Lawrence (12.8%), Chelsea (14.3%), Revere (14.5%), and Everett (15.9%) (data not shown). • SOURCE:2010 American Community Survey (ACS).
NUMBER OF UNINSURED NON-ELDERLY ADULTS 19 TO 64 IN MASSACHUSETTS, 2010 • In 2010, the highest number of uninsured non-elderly adults in Massachusetts was in the Greater Boston Area, with pockets of uninsurancein Springfield and the Southeastern part of the state. • The places in the state with the highest number of uninsured non-elderly adults over the 2008-2010 period were New Bedford (6,415), Lowell (6,422), Worcester (7,630), Springfield (8,792) and Boston (31,473) (data not shown). • SOURCE:2010 American Community Survey (ACS).