Download
1 / 6
60 likes | 68 Vues
Graphing y = e bx Functions. I. . The Natural Base e. A) e ≈ 2.72 B) “e” occurs in nature and in math/science formulas. C) e = as “n” approaches + ∞. D) y = A•e bx+C + D is the natural base exponential function.

E N D
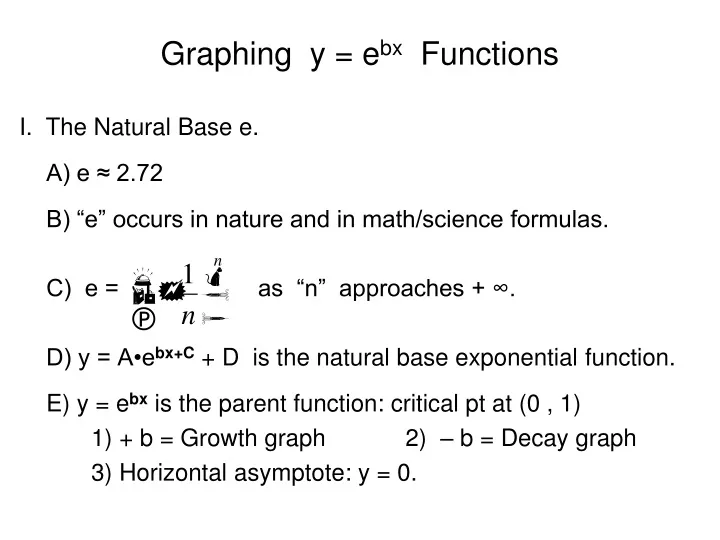
Graphing y = ebx Functions I.. The Natural Base e. A) e ≈ 2.72 B) “e” occurs in nature and in math/science formulas. C) e = as “n” approaches + ∞. D) y = A•ebx+C + D is the natural base exponential function. E) y = ebx is the parent function: critical pt at (0 , 1) 1) + b = Growth graph 2) – b = Decay graph 3) Horizontal asymptote: y = 0.
Graphing y = ebx Functions II.. Natural Base Exponential Function Shifts y = A•ebx+C + D A) y = ebx + D “D” moves the graph up (+) or down (–). 1) It also moves the horizontal asymptote: y = D. B) y = ebx+C moves the graph sideways. 1) Set the exponent part = 0 and solve for x (Bx + C = 0) That is the sideways shift. C) y = A•ebx the “A” term is the “slope”. 1) A > 1 is V stretch 2) 0< A <1 is V shrink 3) –A flips over x-axis D) y = ebx the sign of the “b” term determines growth/decay 1) +b = growth graph 2) –b = decay graph
Graphing y = ebx Functions III.. Sketching Natural Base e Functions ( y = A•ebx+C + D ). A) State all the shifts. B) Find the new critical point (0 , 1) ( # , # ) 1) new crit pt = (sideways shift, first # + last #) or ( bx + C = 0 , A + D ) C) The new horizontal asymptote is y = D. D) Look at the “slope” (A term) to see if it is a flip graph or not. E) Determine if it is a Growth or Decay graph (the “b” sign). F) Sketch the horizontal asy. and the critical point. 1) Draw the Growth / Decay (or flipped) graph from crit pt.
Graphing y = ebx Functions Examples: 1) y = 3e4x+8 – 6 2) y = ½e–4x+12 + 4 4x + 8 = 0 Growth – 4x + 12 = 0 Decay 4x = –8 – 4x = –12 x = –2 x = 3 2 6 steeper 3 4 less steep crit pt = ( – 2 , – 3 ) crit pt = ( 3 , 4.5) H asy: y = – 6 H asy: y = 4 (3 , 4.5) (–2 , –3)
Graphing y = ebx Functions IV.. Properties of Exponents A) xm • xn = xm+n (Add the exponents) B) (Subtract the exponents) C) (Multiply the exponents) D) and (Negative expo flip) E) (Simplify radicals)
Graphing y = ebx Functions V.. Evaluating ex with a calculator. A) There are two “e” buttons on the TI-84 calculators. * 1) 2nd ex displays e^( on the screen. 2) 2nd e displays e on the screen. B) The Nspire has the button ex. Example: Find 3e4 + 7 On the TI-84 On the Nspire 3 • e^(4) + 7 = 170.79 3e4 + 7 = 170.79