Download
1 / 66
680 likes | 1.02k Vues
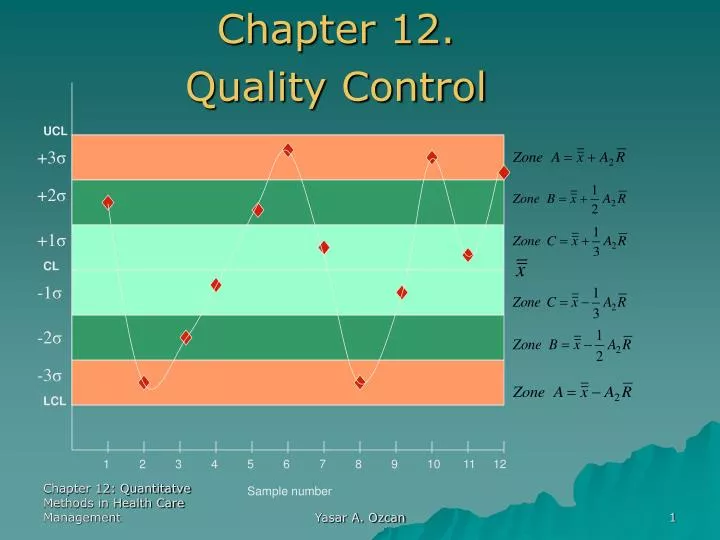
UCL. +3 σ. +2 σ. +1 σ. CL. -1 σ. Chapter 12. Quality Control. -2 σ. -3 σ. LCL. 1. 2. 3. 4. 5. 6. 7. 8. 9. 10. 11. 12. Sample number. Outline. Quality in Healthcare Quality Experts Quality Certification TQM & CQI Six-Sigma Monitoring Quality through Control Charts

E N D
UCL +3σ +2σ +1σ CL -1σ Chapter 12. Quality Control -2σ -3σ LCL 1 2 3 4 5 6 7 8 9 10 11 12 Sample number Yasar A. Ozcan
Outline • Quality in Healthcare • Quality Experts • Quality Certification • TQM & CQI • Six-Sigma • Monitoring Quality through Control Charts • Control Charts for Attributes • Control Charts for Variables • Process improvement • Methods for Generating New Ideas • Tools for Investigation Yasar A. Ozcan
A Broad Definition. . . • Quality refers to the ability of a product or service to consistently meet or exceed customer expectations • quality in healthcare is evaluated from differing perspectives of providers, recipients and third-party payers. • Most clinicians accept the Institute of Medicine (1990) definition: “Quality is the extent to which health services for individuals and populations increase the likelihood of desired health outcomes and are consistent with current professional knowledge.” Yasar A. Ozcan
What is quality? You are a world renowned surgeon that has just completed a radical new surgical technique. There were few complications, largely due to the excellence of the hospital’s staff and technological capabilities. QUALITY? Yasar A. Ozcan
What is Quality? You are a patient who has just undergone radical new surgery. Although the surgery went without technical difficulties, your were upset at the doctor’s uncaring attitude. Furthermore, the nursing staff often failed to respond to your calls, and twice you were served meat despite the fact that you are a vegetarian. Also, there was a used bedpan that sat next to your bed for three days. QUALITY? Yasar A. Ozcan
A question of perspective • Quality of care depends upon who is making the assessment • Clinician-- technical components, adequate skills, resources, conditions • Patients-- outcomes, interpersonal processes, amenities, overall satisfaction • Health Facility Managers- appropriate and effective utilization • Community-- availability, access, reputations, general health status of community Yasar A. Ozcan
Quality Measurement • Clinicians-- cure rates, mortality, morbidity • Patients-- patient satisfaction surveys • Health facility managers-- cure rates, mortality, morbidity, intermediate process measures (patient falls, infection rates, medication errors, appropriate staffing, etc.) • Community-- area service distribution, insurance coverage, incidence and prevalence rates, etc. Yasar A. Ozcan
Process Structure Outcome Conversion Process Inputs Outputs (Throughput) Figure 12.1 Quality Measurement Treated Patient Patient, provider labor equipment supplies, etc. Various hospital and medical services transform poor health to wellness for patients (diagnosis, procedures, treatments) Yasar A. Ozcan
Quality Measurement Quality Gaps • Another way to look at the maintenance of quality is how mistakes are to be avoided – design mistake-proof processes across the whole spectrum of the care, to reduce undesired outcomes. • Variance in diagnostic and therapeutic interventions and the associated errors hamper the delivery of safe, effective patient care and add to poor outcomes. • To minimize the variation and the errors – sometimes euphemistically called “quality gaps” – and work toward completely eliminating them are major goals for healthcare systems. Yasar A. Ozcan
Quality Measurement Quality Gaps Chassin (1998) classifies the underlying causes of “quality gaps” into three categories: 1) Over-utilization. When the potential benefit of a therapy is less than its risk, overuse of health services affects the quality of care. Pressures for overuse of services may come from either providers or patients. 2) Under-utilization. A patient’s lack of insurance or insurance that has high co-payments and deductibles can cause under-utilization of necessary health care. 3) Miss-utilization. Avoidable complications, negligent care, mistakes, and mishaps create miss- utilization of services. Healthcare providers who generate such conditions harm the quality of patient care and produce poor outcomes; they also waste the organization’s resources and increase lengths of stay. Yasar A. Ozcan
Quality Measurement • Healthcare providers do have an arsenal of methods to deal effectively with the problems affecting quality of care. • They include the programs called quality control (QC), total quality management (TQM), continuous quality improvement (CQI), reengineering, and Six-Sigma. • All these programs include data gathering, analysis and statistical monitoring to identify the problem and its cause. • Nevertheless, the crux of the solution to quality problems lies in changing human behavior, changing minds to perform care in new ways. Yasar A. Ozcan
Quality Experts • Deming-- poor quality caused by the system, not employees; management’s responsibility to correct system;” use 14 points to reduce variation caused by special causes (correctable) and not common (random) causes of variation. • Juran-- 80% of defects are controllable; three elements: quality planning, quality control, and continual quality improvement • Crosby-- zero defects; quality is free • Isikawa-- cause and effect diagrams, quality circles Yasar A. Ozcan
Quality Certification • Organizations can earn awards or achieve certification/accreditation by international organizations or by their own trade organizations; for instance, hospitals are evaluated periodically by the Joint Commission on Accreditation of Healthcare Organizations (JCAHO). • For the medical group practices, the Medical Group Management Association (MGMA) is the principal voice. MGMA leads the profession and assists members through information, education, networking and advocacy” (MGMA, 2004). • Quality is always a major concern in those advocacy and accreditation bodies. Yasar A. Ozcan
Quality Certification • ISO 9000 • Set of international standards on quality management and Quality assurance, critical to international Business • ISO 9000 series standards, briefly, require firms to document their quality-control systems at every step (incoming raw materials, product design, in-process monitoring and so forth) so that they’ll be able to identify those areas that are causing quality problems and correct them. • ISO 9000 requires companies to document everything they do that affects the quality of goods and services. • Hierarchical approach to documentation of the Quality Management System Yasar A. Ozcan
Total Quality Management • A philosophy that involves everyone in an organization in the quest for quality, with customer satisfaction as the driving force • TQM involves: • finding what customers want • designing services to meet customer needs • designing mistake proof delivery process “pakayoke” • monitoring results and continuous improvement Yasar A. Ozcan
TQM, cont. • TQM requires: • continual improvement • competitive benchmarking • employee empowerment • team approaches • knowledge of tools • Quality at the source-- each worker responsible for his/her own work • Quality function deployment-- involve customers in service design Yasar A. Ozcan
Controlling Quality • Quality control focuses on the conversion of inputs into outputs, i.e., the processes • Goal is to reduce the need for inspection of control efforts • Quality assurance efforts occurring during production of services are referred to as statistical process control Yasar A. Ozcan
Figure 12.2 The Deming Wheel/Shewhart Cycle Plan Act Do Check Yasar A. Ozcan
Continuous Quality Improvement • A philosophy seeking to make never-ending improvements to the process of converting inputs into outputs • Kaizen-- Japanese term referring to CI • Environment must be conducive to CI • appropriate vision statement, strategies, tactics • management style encouraging trust, openness • adherence to stated philosophy • reward/incentive systems Yasar A. Ozcan
Continuous Quality Improvement The CQI is a detailed version of a PDSA cycle that comprises: • selecting a process that needs an improvement • studying and documenting the current process seeking ways to improve it • designing an improved process • implementing the new process • monitoring and evaluation • documenting the process if it worked successfully and publicizing it through the healthcare organization • if it did not achieve its goals, re-starting from step 1. Yasar A. Ozcan
Six-Sigma • Six- Sigma is one of the latest quality improvement concepts to have emerged during the 1990’s. Its name comes from the measure of variation from the normal distribution (six standard deviations). • Adopting a six-sigma strategy as a quality goal sets tolerance levels for errors (defectives) to levels that occur only 3.4 times per million observations. • The defect rates in healthcare can be defined in such distinct areas as public health, inpatient care, ambulatory care, and so on. Yasar A. Ozcan
Six-Sigma Healthcare organizations have reduced the deaths caused by anesthesia from 25-50 per million cases to 5 per million cases since the 1980s through improved monitoring techniques, adaptation of practice guidelines, and other systematic approaches to reduce errors. This is one area that comes very close to six sigma standards (Chassin, 1998). Yasar A. Ozcan
Six-Sigma Deployment of six-sigma to improve the quality of healthcare and delivery performance can be considered in the following areas: a) Clinical excellence b) Service delivery c) Service costs, and d) Patient satisfaction. The deployment can use either of these methodological sequences: DMAIC: define, measure, analyze, improve, and control DMADV: define, measure, analyze, design, and verify. DMAIC is generally used to improve existing systems that have fallen the below six-sigma levels, DMADV is used to design and develop new processes or products at six-sigma levels (Stahl, Shultz, and Pexton, 2003). Yasar A. Ozcan
Six-Sigma The essence of six-sigma methodologies is both improvement of the knowledge and capability of employees, and also changes behavior through training. Thus six-sigma employs a classification system that identifies education and training for employees, project managers and executives. Emulating karate honors, certification is granted at Green Belt (GB), Black Belt (BB) and Master Black Belts (MBB) levels. Yasar A. Ozcan
Six-Sigma Green Belts (GBs) are the employees who have taken the training courses on implementing the projects. Black Belts (BBs) are the project leaders, whose training may be more intensive; they may complete several projects a year depending upon their size and scope. Master Black Belts (MBBs) are generally assigned to an area that needs improvement (for example, human resources), to ensure that objectives are set, targets are identified, plans are made, and resources are secured to implement the projects in their assigned area. MBBs may oversee many six-sigma projects at a time, working with various BBs. Yasar A. Ozcan
Six-Sigma Six-sigma projects require BBs and MBBs to have expertise in basic statistical tools such as Pareto Diagrams, descriptive and higher level statistics including regression, and statistical modeling techniques as well as control processes. In addition to statistical concepts, they are expected understand project management, finance, leadership, measurement through socio-metric (survey) analysis, reliability and validity. Yasar A. Ozcan
Six-Sigma • Examples of successful six-sigma deployments in healthcare include: • reduction of emergency room diversions • fewer errors in operating rooms’ cart materials • reduced bloodstream infections in an ICU, and • improved radiology turnaround time (Stahl, Shultz, and • Pexton, 2003). Yasar A. Ozcan
Quality Measurement and Control Techniques Process Variability In the delivery of health care, there are many occasions when an error can happen in the tasks performed by various clinical staff. Often the same task may not even be performed the same way for all patients, though minor alterations within defined limits can be acceptable. When provider performance falls beyond acceptable limits, the errors that occur require investigation and correction. In order to detect noteworthy variations in process, or tendencies that may cause unacceptable levels of errors, healthcare managers must monitor the processes for quality, using various charts. The intent of the monitoring is to distinguish between random and non-random variation. Yasar A. Ozcan
Quality Measurement and Control Techniques Process Variability The common variations in process variability that are caused by natural incidences are in general not repetitive, but various minor factors due to chance and are called random variation. If the cause of variation is systematic, not natural, and the source of the variation is identifiable, the process variation is called non-random variation. In healthcare, non-random variation may occur by not following procedures, using defective materials, fatigue, carelessness, or not having appropriate training or orientation to the work situation, among many reasons. Yasar A. Ozcan
Quality Measurement and Control Techniques Process Variability Process variation is the range of natural variability in a process for which healthcare managers use control charts to monitor the measurements. If the natural variability or the presence of random variation exceeds tolerances set by control charts, then the process is not meeting the design specifications. Yasar A. Ozcan
Figure 12.3 Process Capability UCL Process variability does not meet design specifications Process variability meets and exceeds specifications Set design specifications for process capability Process Variability LCL Yasar A. Ozcan
Figure 12.4 Control Limits, Random and Nonrandom Sample Observations Non-random α/2 Upper Control Limit (UCL) +2σ Process Mean 95.5% -2σ Lower Control Limit (LCL) α/2 1 2 3 4 5 6 7 8 9 10 11 12 Sample number Yasar A. Ozcan
Control Charts for Attributes When process characteristics can be counted, attribute-based control charts are the appropriate way to display the monitoring process. If the number of occurrences per unit of measure can be counted, or there can be a count of the number of bad occurrences but not of non-occurrences, then a c-chart is the appropriate tool to display monitoring. Counting also can occur for a process with only two outcomes, good or bad (defective); in such cases p-chart is the appropriate control chart. Yasar A. Ozcan
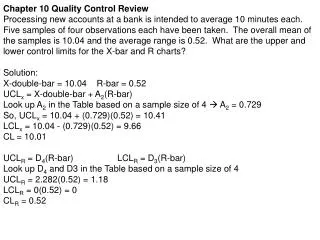
Control Charts for Attributes: c-Chart Yasar A. Ozcan
Control Charts for Attributes: c-Chart Example 12.1 The number of infections from the Intensive Care Unit (ICU) at the ABC Medical Center over a period of 24 months is obtained. These numbers are the counts of stool assay positive for toxin, segregated by month. The patient population and other external factors such as change in provider have been stable. The nurse manager who serves on the quality team wants to discover whether the infections are in control within 95.5% confidence limits. Yasar A. Ozcan
Control Charts for Attributes: c-Chart Solution If we consider each month as a sample of bad quality outcomes, for 24 samples we have a total of 96 quality defects (infections), and the average would be: = 96/24 = 4.0. Since the z-value for 95.5% confidence level is equal to 2, using formulas we obtain: Yasar A. Ozcan
Figure 12.5 ABC Medical Center Infection Control Monitoring UCL=8 Infections per month LCL=0 1 2 3 4 5 6 7 8 9 10 11 12 13 14 15 16 17 18 19 20 21 22 23 24 Sample number Yasar A. Ozcan
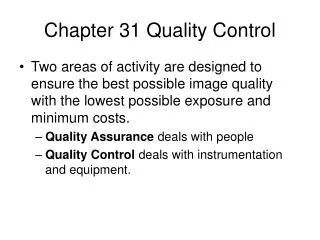
Control Charts for Attributes: p-Chart The proportion of defects in a process can be monitored using a p-chart that has binomial distribution as its theoretical base. The center of the p-chart represents the average for defects and LCL and UCL are calculated as: Yasar A. Ozcan
Control Charts for Attributes: p-Chart Example 12.2 The indicator Family Satisfaction, which is part of the National Hospice and Palliative Care Organization’s survey, reflects the percentage of respondents who would not recommend the hospice services to others. The following data are from Holistic Care Corporation’s completed surveys from 200 families each month during a year, showing the number of respondents each month who expressed dissatisfaction with the organization’s services. The manager in charge of quality wishes to construct a control chart for this data within 95.5% confidence intervals. Yasar A. Ozcan
Control Charts for Attributes: p-Chart Solution: First, we need to estimate the proportion mean, Total number of quality infractions 192 192 = -------------------------------------------- = ----------- = ------- = .08 Total number of observations 12 (200) 2400 Since the z value for the 95.5% confidence level is equal to 2.0, using formulas we obtain: Yasar A. Ozcan
Figure 12.6 Holistic Care Corporation’sQuality Monitoring UCL=.118 Proportion of Families Dissatisfied LCL=0.042 1 2 3 4 5 6 7 8 9 10 11 12 Sample number Yasar A. Ozcan
Figure 12.7 Use of Mean and Range Charts UCL Process Mean LCL Stable mean, increasing range process UCL LCL Increasing mean, stable range process Mean indicator Range indicator Yasar A. Ozcan
Control Charts for Variables Mean Charts - Standard Deviation Approach. In general the population standard is unknown, and so the average of sample means and the standard deviation of sample distribution σ are used to construct the confidence limits as: . where σ Yasar A. Ozcan
Control Charts for Variables: Mean Chart, σ Method Example 12.3 With a time-motion study, the IV startup process has been examined in a medical center nursing unit for five weekdays to determine whether in the future, additional training of nurses is required. Each day 9 new patients’ IV startups were observed and the measurements recorded in minutes, as shown below. Construct 99.7% (z = 3) confidence limits for IV startup times. Yasar A. Ozcan
Control Charts for Variables: Mean Chart, σ Method Solution Observation means for each day (sample) are calculated and are shown in the last rows of the following table. = (5.51+5.88+5.73+5.86+5.46) ÷ 5 = 5.69. with z = 3, n = 9 observations per sample (day), and s = 0.6, we obtain: Yasar A. Ozcan
Control Charts for Variables Mean Charts - Range Approach. Another way to construct a mean chart is to use the average of sample distribution ranges,. This approach requires a factor to calculate the dispersion of the control limits. . Where A2 is a factor from Table 12.1 Yasar A. Ozcan
Table 12.1 Factors for Determining Control Limits for Mean and Range Charts (for 3-sigma or 99.7% confidence level) Source: p. 143, Operations Management by Rusell & Taylor, 1995. Yasar A. Ozcan
Control Charts for Variables: Mean Chart, Range Method Example 12.4 During 5 weekdays, each day the number minutes spent for each of 10 patient registration operations were observed in a time study as follows: Yasar A. Ozcan
Control Charts for Variables: Mean Chart, Range Method Solution The overall mean for each sample and range is required to apply the formulas, using the range approach. Here each day is considered as a sample. The range is calculated by taking the difference between the maximum and minimum of each sample (day). The, mean for each day also is calculated and shown as follows: = (10.12+10.19+9.84+9.85+10.13) ÷ 5 = 10.03. = (2.4+2.4+1.6+1.6+2.3) ÷ 5 = 2.06. UCL = 10.03 + 0.31 (2.06) = 10.67. LCL = 10.03 – 0.31 (2.06) = 9.39. Yasar A. Ozcan
Control Charts for Variables Range Charts Process dispersion is best monitored by range charts. The control limits for range charts are constructed using factors. To calculate LCL, factor score D3 is obtained from a factor chart (Table 12.1) based on the number of observations in the sample distributions. Similarly, to calculate UCL, factor score D4 is required. Control limits for range charts using these factor scores are then constructed as follows: . Yasar A. Ozcan