Download
1 / 65
680 likes | 866 Vues
Using Data f or Continuous School Improvement. Goal 2 SLDS Grant. Provide a statewide system of professional development training for data analysis that reaches every district. Tiered Training Delivery ✔. School District Staff. School District Leadership. ESUs and NDE Staff ✔.

E N D
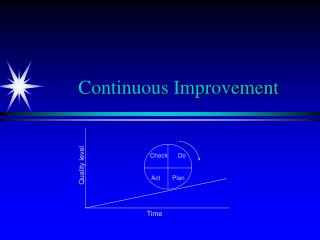
Using Data for Continuous School Improvement
Goal 2 SLDS Grant Provide a statewide system of professional development training for data analysis that reaches every district. Tiered Training Delivery ✔ School District Staff School District Leadership ESUs and NDE Staff ✔ Statewide Data Cadre ✔
Statewide Data Cadre • Higher Ed • Dick Meyer – UNK • ESUs/ESUCC • Rhonda Jindra – ESU 1 • Mike Danahy – ESU 2 • Marilou Jasnoch – ESU 3 • Annette Weise – ESU 5 • Lenny VerMaas – ESU 6 • Denise O’Brien – ESU 10 • Melissa Engel – ESU 16 • Jeff McQuistan – ESU 17 • NDE • Data, Research, Evaluation • Russ Masco • Matt Heusman • Rachael LaBounty • Kathy Vetter • Assessment • John Moon • Federal Programs • Beth Zillig • Special Education • Teresa Coontz • Curriculum • Cory Epler • Tricia Parker-Siemers • Accreditation and School Improvement • Don Loseke • Sue Anderson
Nebraska Data Literacies Did our response produce results? What do the data show? Why might this be? How should we respond? Data Comprehension Data Interpretation Data Use Evaluation
Data Literacies Format Literacy 1. Concept a. Indicators i.
Data Literacies http://www.education.ne.gov/DataServices/SLDS_Grant/Data_Literacies.pdf
Nebraska Data Literacies and Their Relationship to the Continuous School Improvement Process
Nebraska Data Literacies Did our response produce results? What do the data show? Why might this be? How should we respond? Data Comprehension Data Interpretation Data Use Evaluation
Data Use Curriculum Nebraska Data Literacies
Bernhardt, V.L. (2013) Data Analysis for Continuous School Improvement (Third Edition) New York, NY: Routledge
Page 14 Data Literacy 1 What do the data show? Where are we now? Data Literacy 2 Why might that be? How did we get to where we are? Data Literacy 2 Why might that be? Where do we want to be? Data Literacy 3 How should we respond? How are we going to get to where we want to be? Data Literacy 4 Did our response produce results? Is what we are doing making a difference?
Data Analysis for Continuous School Improvement Is About What You Are Evaluating Yourself Against
Data Literacy 1 What do the data show?
Data Literacy 2 Why might that be?
Data Literacy 2 Why might that be?
Data Literacy 3 How should we respond?
Data Literacy 4 Did our response produce results?
IMPORTANT NOTES • Continuous School Improvement describes the work that schools do, linking the essential elements • Continuous School Improvement is a process of evidence, engagement, and artifacts
A PROCESS OF EVIDENCE, ENGAGEMENT, AND ARTIFACTS • Evidence: • Data to inform and drive a logical progression of next steps. • Engagement: • Bringing staff together to inform improvement through the use of data, moving from personality driven to systemic and systematic. • Artifacts: • The documentation of your improvement efforts.
Data Literacy 1 What do the data show?
DEMOGRAPHICS AREIMPORTANT DATA • Describe the context of the schooland school district. • Help us understand all other numbers. • Are used for disaggregatingother types of data. • Describe our system and leadership.
DEMOGRAPHICS • Enrollment • Gender • Ethnicity / Race • Attendance (Absences) • Expulsions • Suspensions
DEMOGRAPHICS (Continued) • Language Proficiency • Indicators of Poverty • Special Needs/Exceptionality • IEP (Yes/No) • Drop-Out/Graduation Rates • Program Enrollment
STAFF DEMOGRAPHICS • School and Teaching Assignment • Qualifications • Years of Teaching/At this School • Gender, Ethnicity • Additional ProfessionalDevelopment
PERCEPTIONS AREIMPORTANT DATA • Help us understand whatstudents, staff, and parents are perceiving about the learning environment. • We cannot act differently from what we value, believe, perceive.
PERCEPTIONS INCLUDE • Student, Staff, Parent,Alumni Questionnaires • Observations • Focus Groups
PERCEPTIONS What do you suppose students say is the #1 “thing” that has to be in place in order for them to learn?
Perceptual Data • Surveys are available for students, parent, staff, for districts/schools that will work with their ESU staff developer to learn how to analyze the perceptual data • Districts/schools complete a (revised) form Schools receive links to the surveys • Schools and ESU staff developer will receive the perceptual survey data
Perceptual Data • Ability to administer surveys will be available in future years as well • NDEs capacity to manage the perceptual data surveys is developing • The data belongs to the districts/schools
STUDENT LEARNING AREIMPORTANT DATA • Know what students are learning. • Understand what we are teaching. • Determine which studentsneed extra help.