Download
1 / 24
240 likes | 355 Vues
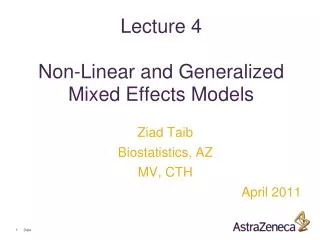
Lecture 4 Linear random coefficients models. Rats example. 30 young rats, weights measured weekly for five weeks Dependent variable (Y ij ) is weight for rat “i” at week “j” Data: Multilevel: weights (observations) within rats (clusters). Individual & population growth.

E N D
Rats example • 30 young rats, weights measured weekly for five weeks • Dependent variable (Yij) is weight for rat “i” at week “j” • Data: • Multilevel: weights (observations) within rats (clusters)
Individual & population growth • Rat “i” has its own expected growth line: • There is also an overall, average population growth line: Weight Pop line (average growth) Individual Growth Lines Study Day (centered)
Improving individual-level estimates • Possible Analyses • Each rat (cluster) has its own line: intercept= bi0, slope= bi1 • All rats follow the same line: bi0 = 0, bi1 = 1 • A compromise between these two: Each rat has its own line, BUT… the lines come from an assumed distribution E(Yij | bi0, bi1) = bi0 + bi1Xj bi0 ~ N(0, 02) bi1 ~ N(1, 12) “Random Effects”
A compromise: Each rat has its own line, but information is borrowed across rats to tell us about individual rat growth Weight Pop line (average growth) Bayes-Shrunk Individual Growth Lines Study Day (centered)
Bayesian paradigm provides methods for “borrowing strength” or “shrinking” Bayes Weight Weight Pop line (average growth) Pop line (average growth) Bayes-Shrunk Growth Lines Individual Growth Lines Study Day (centered) Study Day (centered)
Inner-London School data:How effective are the different schools? (gcse.dat,Chap 3) • Outcome: score exam at age 16 (gcse) • Data are clustered within schools • Covariate: reading test score at age 11 prior enrolling in the school (lrt) • Goal: to examine the relationship between the score exam at age 16 and the score at age 11 and to investigate how this association varies across schools
Fig 3.1: Scatterplot of gcse vs lrt for school 1 with regression line)
Linear regression model with random intercept and random slope centered
Alternative RepresentationLinear regression model with random intercept and random slope
Fig 3.3: Scatterplot of intercepts and slopes for all schools with at least 5 students
Linear regression model with random intercept and random slope The total residual variance is said to be heteroskedastic because depends on x Model with random intercept only
Empirical Bayes Prediction(xtmixed reff*,reffects) In stata we can calculate: EB: borrow strength across schools MLE: DO NOT borrow strength across Schools
Correlation between random effects Between Schools variance Within school variance
Growth-curve modelling (asian.dta) • Measurements of weight were recorded for children • up to 4 occasions at 6 weeks, and then at 8,12, and 27 months • Goal: We want to investigate the growth trajectories of • children’s weights as they get older • Both shape of the trajectories and the degree of variability are of interest
What we see in Fig 3.12? • Growth trajectories are not linear • We will model this by including a quadratic term for age • Some children are consistent heavier than others, so a random intercept appears to be warranted
Quadratic growth model with random intercept and random slope Fixed effects Random effects Random effects are multivariate normal with means 0, standard deviations tau_11 and tau_22 and covariance tau_12
Results for Quadratic Growth Random Effects Model Random intercept standard deviation Level-1 residual standard deviation Correlation between baseline and linear random effects….
Two-stage model formulation Stage 1 Stage 2 Fixed Effects Random Effects
Results from Random intercept and slope model with and without inclusion of gender effect