Download
1 / 30
320 likes | 464 Vues
Detection of Infrasonic Events Using a Sparse Global Network of Infrasound Stations. Michael O’Brien 1 , Manoch Bahavar 1 , Eli Baker 1 , Milton Garces 2 , Claus Hetzer 2 , Hans Israelsson 1 , Charles Katz 1 , Colin Reasoner 1 , and Jeff Stevens 1

E N D
Detection of Infrasonic Events Using a Sparse Global Network of Infrasound Stations Michael O’Brien1, Manoch Bahavar1, Eli Baker1, Milton Garces2, Claus Hetzer2, Hans Israelsson1, Charles Katz1, Colin Reasoner1, and Jeff Stevens1 1.Science Applications International Corporation 2.University of Hawaii Infrasound Technology Workshop University of California, San Diego October 27-30, 2003
Outline • Challenges • Approach • Data sets • Detector optimization • Clutter classification • Network detection simulation • Ongoing work • Summary
Challenges in Infrasound Monitoring Propagation Source Receiver
Detection Approach Detection evaluation Canonical detection data set Final Detections Detection tuning Tuned recipes Detection algorithm Initial Detections Waveform database Clutter classification Clutter ID rules Clutter ID algorithm Noise estimation Noise spectra and PDFs Detection simulation Detection capability Synthetic signals ROC analysis SNRs
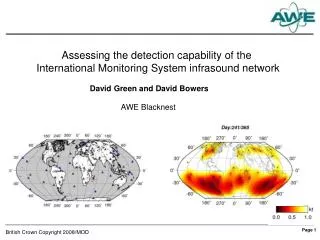
Project Network • All stations available in June 2003
Canonical Detection Data Set • Focuses on signals of interest: • Surrogates for atmospheric nuclear explosions • Waveforms and arrivals for • Bolides (7) • Chemical explosions (2) • Scaled nuclear explosions embedded in ambient noise
Fixed Data Set • Objective • Provide a standard reference for assessing processing in absence of signals of interest (e.g., false-alarm rates) • Contents • Contiguous 7-day time interval in April 2003 of all seismic, hydroacoustic and infrasound data currently received • April 1-7 selected based on total percentage data coverage • Seasonal 3-day contiguous time intervals of all infrasound data currently received • May 5-7, 2002: northern spring • August 5-7 , 2002 : northern summer • November 5-7, 2002: northern autumn • February 5-7, 2003: northern winter
Detector Optimization Approach • Detector used • Detection and Feature Extraction (DFX / libinfra) • Same as former PIDC detector • Processing parameters (libinfra) • Governed by inter-spacing of group of array elements • Frequency band from 0.1 - 4.5 Hz depending on diameter of element group • Data window for correlation between 30 and 90 sec
Detector Optimization Approach (2) • Key detector parameters: • Thresholds for correlation and signal energy • Lengths of data windows • Parameters tuned against scaled waveforms implanted into real station data (ambient noise for this purpose) • Explosion implants (about 100 per array): • Derived from recordings of historical atmospheric explosions • Scaled to different yields and distances < 2000 km • Receiver Operator Characteristic (ROC) curves computed for various parameter settings • Parameters chosen to maximize detection of implants at an acceptable overall detection rate (100-200 / day) • Parameters validated with data from different seasons
Detection of Scaled Events: I33MG • ~ 80% of implants detected • Smaller sources have detections at higher frequencies • Larger sources have detections at lower frequencies Detections Made by DFX/libinfra on I33MG Implants (~100) # of detections # of detections / implant Equivalent Pressure (PA)
I33MG Detection Efficiency • Derived from previous plot (scaled embedded explosion waveforms) fraction of implants detected equivalent pressure (Pa)
Receiver Operator Characteristic (ROC) • Stations fall in performance categories • High:DLIAR, I08BO, I55US • Intermediate:I33MG, IS07 • Low :I24FR, I57US • Local clutter limits detection ability fraction of implants detected (Probability of Detection) detection rate on raw data [per day] (False Alarm Rate)
Detector Optimization • Performance of detector: • Depends critically on correlation threshold • Much less sensitive to energy threshold • Performance improved by use of robust estimator of array correlation: • One accidentally correlated site pair can strongly contaminate arithmetic mean of all correlation pairs for array • False alarms can be reduced significantly by computing median instead
Detector Optimization (2) • Different length processing windows are sensitive to different explosion signals • Shorter windows sensitive to shorter, more impulsive signals • Longer windows sensitive to longer, less compact signals • Probability of detection improved significantly by processing data sequentially with multiple data windows of different length • Multiple detections often made on the same signal • Similar slowness vector, closely spaced in time • Primary detector not sophisticated enough to recognize these as the same signal
False Alarm Rate Reduction • Too many detections can complicate downstream analysis • Detection clustering • Primary detection processing generates multiple detections of the same signal • If we can associated them with one another, we can replace multiple detections with one • Clutter rejection • Most detections relate to energy in which we are not interested • If we can identify them as clutter we can remove them from further consideration
Detection Clustering • Look for similar features among detections: • Slowness, azimuth and frequency • Apply threshold on the difference for each feature separately (tuning parameters) • Assumes features of a given signal will at worst vary slowly • Look for temporal proximity of detections • Compute a weighted integral of the past time during which a signal with similar features was detected • Use a weighting function that decays exponentially from present • Threshold, characteristic time and look back are tuning parameters
Clutter Rejection • Based on repeatable nature of clutter signal features • Slowness, azimuth, frequency and duration • Approach • Tabulate/compute probabilities of occurrence of features for: • Signals of interest (theoretical) • Station-specific clutter (empirical) • Implement a post-detection process that labels likely clutter detections – formulate a statistic based on probability functions of clutter and signal on the feature space: • Chose threshold to optimize false alarm rate
Clutter Characterization Approach • Pass data through PMCC for detection and estimation of features for each detection • Compare detection feature sets to known clutter sources (if any) and tabulate results, subsequently using detections associated with known sources to refine features of those sources • Record unmatched detections and bin similar signals in feature space (e.g. azimuth-velocity-frequency) • Define new clutter sources based on contents of bins (number of detections per unit of time)
Network Detection Simulation • Ambient noise estimation • Receiver Operator Characteristic (ROC) curves • Preliminary simulations using NetSim
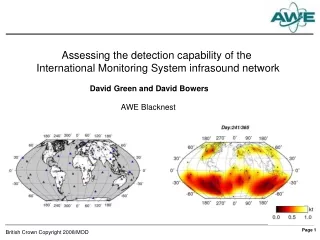
Ambient Noise Estimation • Objectives • Characterize all current infrasound stations using consistent approach • Provide quantitative noise estimate for network detection simulations • Spectra estimated for all 19 stations of project network • ~ 8 months of data • January 12 – August 31, 2003 (data on spinning disk archive) • 4 times/day (0100, 0700, 1300, 1900 local time) • 21 consecutive non-overlapped 180 second spectra for each hour • 0.03 – 10 Hz • Probability Density Functions (PDF) estimated for each processing band
Ambient Noise for Project Network • All times of day • All stations with spectra for both months and no apparent quality problems • No compensation for southern/northern seasons
Noise Probability Density Function • Objective • Provide time-domain estimation of noise in same passbands used for signal detection • Provide non-Gaussian representation of noise 0.5-1.0 Hz 0.5-1.0 Hz Number of noise intervals
Receiver Operator Characteristic (ROC) Curves • Good illustration of effect of clutter on Pd • Notice ~10 dB lower implant SNR for same Pd in the 0.5-1.0 Hz band (0.5-1.0 Hz) (0.1-0.5 Hz)
Preliminary Network Detection Simulation • NetSim program • Gaussian approximation of noise • 2 station detection 90% probability • Winds not yet included Contours in kilotons
Ongoing Work • Detector tuning • Tune for mine explosions using observed signals recorded at I07AU, I10CA PDIAR and TXIAR • Quantify detector performance using reference data set • Clutter classification • Refine classification approach • Extend to additional station • Complete methodology to suppress selected clutter sources • Network simulations • Interpret ambient noise estimates • Include non-Gaussian noise estimates • Include seasonal winds • Extend to full IMS network by using noise estimates for geographically analogous stations
Summary • Detector tuning • Assembled canonical detection data set for assessing effectiveness of detector • Improved detection performance for current stations (DFX/libinfra) • Clutter classification • Developed methodology for classifying clutter based on measured features • Applied new methodology to classify clutter for several stations • Network simulation • Estimated ambient noise levels for all current stations • Estimated detectable SNRs using ROC curves • Performed initial simulation for current network 30