Download
1 / 36
380 likes | 678 Vues
Optical Sensing Systems. Gisle Vold. History. 1870 : Principle of Total Internal Reflection discovered 1950 : Invention of first laser 1970 : First low-loss fibre produced 1974 : Launch of optical communications 1986 : Introduction of optical amplifiers

E N D
Optical Sensing Systems Gisle Vold
History • 1870 : Principle of Total Internal Reflection discovered • 1950 : Invention of first laser • 1970 : First low-loss fibre produced • 1974 : Launch of optical communications • 1986 : Introduction of optical amplifiers • 1994 : Introduction of multi-wavelength systems • 2000 : Peak of Telecom bubble
Transmission Data Rate and Capacity • Broadband capability of optical fiber allows multiple channel transmission • Currently 128 channels with existing components • Each channel can carry 10Gb/s • Unlike electrical signals, optical signals do not interfere with each other • Each Fiber has an aggregate data rate of 1.28Tb/s = 1,280,000,000,000 bps ! • This translates to: • 20 million simultaneous phone connections (64kb/s each); typical telecom twisted-pair cable 300 phone calls Twisted Pair Copper- MHz - 300 Phone Calls Single Fiber - THz - Over 20 Million Phone Calls 2
What makes us different ? • Operation Principle • Suite of Sensors • Extreme Long Term Stability • Unmatched Durability
P P Input Spectrum Transmitted Spectrum Bragg Grating Operating Principle
UV interference photo-inscribed grating in core Bragg Grating Operating Principle UV laser beams
Reflected component Transmitted light Input Spectrum Transmitted Spectrum P P Reflected Spectrum P B B Bragg Grating Operating Principle
Bragg Grating Operating Principle stretch Strain-induced shift in grating resonance wavelength
Input Spectrum Transmitted Spectrum P P Reflected Spectrum strain-induced P shift B B Bragg Grating Operating Principle Reflected component Transmitted light
Optical Wave 1 Optical Wave 2 Interference of 1 + 2 Interference of Two Optical Waves
Bulk-Optic Michelson Interferometer Path 1 F1=2*p/l*n*L1 Path 2 F2=2*p/l*n*L2 Df=k*(L2-L1)
Two Legs with Mirrors Mirrors Fiber Michelson Interferometer
Fiber Michelson Interferometer Single Leg with Grating Reflectors
What makes us different ? • Operation Principle • Suite of Sensors • Extreme Long Term Stability • Unmatched Durability
The Case for Fiber Optic Sensors • High Reliability • No Downhole Electronics • No Moving Parts • Nominal Part Count • Ideally Suited For Harsh Environments • High Temperature Capability • Vibration and Shock Tolerant • High Data Transmission Capability • Multiple Sensors on Common Fiber Infrastructure • Technological Advances Driven by Telecom
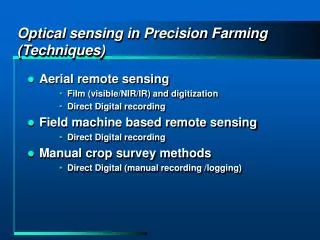
Temperature Profiling • Thermal profile of well • Production and injection profiling • Identify well problems • Monitor water, gas, steam breakthrough • Artificial lift monitoring • Distributed Temperature Sensing (DTS) and Array Temperature Sensing (ATS)
DTS - Operation Principle Laser source PulseModulator Fiber T e m p e r a t u r e P r o f i l e T(z) Spectrometer Scattered light at location z Spectral Processing Raman Stokes/Anti-Stoke Ratio Processing T(z) Surface Unit
Raman Stokes Anti-Stokes ratio DTS – measurement principle
Array Temperature Sensing • Accurate/stable point measurements • 15-18 points/fiber • P/T gauge can be deployed on same fiber • 1 P/T + 12 ATS • <0.01°C (0.018°C) temperature resolution • Update rate 3 – 5 seconds • Similar technology to Weatherford optical P/T gauge • Glass microstructure • Manufactured by Weatherford • Integrated into standard ¼” Inc 825, 3-fiber cable • Temperature sensor isolated from strain • Standard deployment techniques • Location of sensors needs to be defined in advance of installation • Same instrument as optical P/T gauge (platform or subsea) • Long distance (>30km) reach • Field trials planned for 2006 (land) and 2007 (subsea) Leveraging Existing Technology
Simulation of well candidates • Build model to evaluate DTS sensitivities to : • total flow rate • oil, gas and water profile differences • flow allocation • water breakthrough • gas coning • pressure drawdown • Specific input required from customer
WFT Temperature Profiling Analysis Capabilities • WFT-PLATO software • Three-phase PLT analysis • Statistical optimization • Global statistical modeling of entire well • Automatic determination of flow regime • Interactive visualization • Simultaneous use of all logs and surface information to determine production profile • Emulation capabilities • Temperature Profiling Design & Analysis • Warm-back tests for injectors • Specialized tests for producers • Temperature array array design • Service • Software
Standalone application for viewing DTS data SQL Database, LAS, POSC, ASCII format files Features Animations relative to baseline DTS data User-specified data interval density (in time) User-settable zooming, scaling, gridding, scrolling, smoothing, etc. Intended users Operators – for quick qualitative analysis Production and reservoir engineers – for identifying trends and visualizing specialized tests, e.g., warmback tests in injection wells Temperature Profiling Data Viewer
Why Measure Flow Downhole • Reduce surface facilities and well tests • Eliminates the need for test separator • Handling of high gas rates • Favorable measurement conditions • Allocation from/to multiple zones • Production and Injection well applications • In multi-zone and multi-lateral completions • Commingling • Regulatory requirements • Faster identification of production anomalies
Weatherford’s Optical Flowmeter • Measurements • Flow velocity (gives volumetric flow rate) • Speed of sound (gives gas volume fraction) • Measurement Advantages • Liquid, gas, or multiphase • High accuracy: • single-phase ±1% • multiphase ±5% • Zero drift • Bi-directional flow rate • High turndown ratio, scalable to any pipe size Turndown Ratio is the ratio of the highest to the lowest measurable flow rate
High Performance Broad bandwidth, high sensitivity and wide dynamic range Optical Seismic Sensors 3-component accelerometer hydrophone (prototype only) Standard Weatherford optical backbone Combines with optical PT, DTS & Flowmeter Dry tree solutions available Subsea under development Weatherford’s Clarion™ In-Well Seismic System Life of Well Seismic™ ALL OPTICAL SYSTEM LIFE OF FIELD RELIABILITY
3-C SENSOR RUGGEDIZED SENSOR CARRIER SENSOR MANDREL ARRAY SPOOLING UNIT Clarion™ Deployment in Production/Injection Wells Tubing or casing conveyed
Geophysicists (benefit) Permanent Measurement Repeatability Real time on demand seismic data Passive event gathering Active Seismic event Gathering Calibration of Seabed Sensors Intended Wellbore viewing High resolution Imaging in 4D Timeline Geometry understanding Inversion – Porosity/ Resistivity Fluid Movement understanding Fracture Delineation Bypass Pay Cap Rock Integrity Weatherford’s Clarion™ In-Well Seismic System
Reservoir Engineers (Benefit) Available with P/T, Flow and DTS systems Material Balance help Formation Activity Fracture Tracing Cross Flow Well Balance when shut in Reservoir Loss path Reservoir Boundaries Injection performance Interference Test greater understanding Uncertainty reduction Weatherford’s Clarion™ In-Well Seismic System
Drilling Engineer (Benefit) Infill well placement Real time seismic while drilling Look ahead Drilling Production Engineer (Benefit) Stimulation Weatherford’s Clarion™ In-Well Seismic System
In-Well Optical Sensing Chronology WORLD-FIRST DOWNHOLE FIBER OPTIC INSTALLATIONS: 1990’s DTS installations 1993 First In-well Optical P/T Gauge 1996 First Subsea Optical P/T Gauge 1999 First In-well Bragg Grating P/T Gauge 1999 First In-well Seismic Accelerometer 2000 First Non-intrusive In-well Fiber Optic Flowmeter 2001 Optical P/T Gauge and DTS in Single Completion 2002 Multiple Optical P/T Gauges in Single Completion 2003 Full 3-phase Fiber Optic Flowmeter with P/T Gauges 2003 Multi-zone Optical P/T Gauges and Remote Flow Control 2004 Multi-zone Optical P/T Gauges and Flowmeters with Remote Flow Control 2004 Casing-conveyed, Multi-station, Seismic with P/T Gauge • Multiple Optical P/T Gauges and DTS Integrated with Sand Control • Offshore Tubing-conveyed, Multi-station, Seismic with P/T Gauge