Download
1 / 21
210 likes | 304 Vues
Land Use Change and Effects on Water Quality in the Lake Tahoe Basin: Applications of GIS. Christian Raumann Research and Technology Team USGS Western Geographic Science Center, Menlo Park, California. Project Background 3-year project funded by a Geographic Research

E N D
Land Use Change and Effects onWater Quality in the Lake Tahoe Basin:Applications of GIS Christian RaumannResearch and Technology TeamUSGS Western Geographic Science Center, Menlo Park, California
Project Background • 3-year project funded by a Geographic Research • Application Prospectus Grant (now in second year) • Multi-agency collaboration: • USGS Menlo Park: Principle investigators • Desert Research Institute, Reno: • Remote sensing specialist and geomorphologist • USGS Water Resources, Carson City: • GIS analyst and hydrologist
Lake Tahoe Basin • Located on the California-Nevada border • in the central Sierra Nevada. • Permanent population of 60,000 • Transient population over 300,000 • 22 million visitors per year. • Destination for snow sports, hiking, • camping, gambling, water sports, and • general tourism. • Significant development during the • past 70 years.
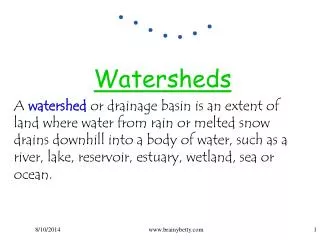
Consequences of Growth Land use change contributes to a highly disturbed ecosystem. Increase in impervious surfaces: any material that prevents the infiltration of water into soil and thereby changing the flow dynamics, sedimentation load, and pollution profile of storm water runoff (roofs, roads, parking lots, sidewalks, etc.). Major issue: Decrease in Lake Tahoe water quality (~1.5 feet/year) due to increased nutrient and pollutant loading.
Pilot Study Area Upper Truckee River and Trout Creek Watersheds Develop methods and test hypothesis, then apply them to the entire basin. Representative of all land use/land cover types in the Tahoe Basin. Contains the most developed area of the Basin: City of South Lake Tahoe. Many agencies (TRPA, USFS), private companies (Sierra Pacific), and community groups (UTWFG) involved in related projects.
Currently Available Digital Data Must have GIS data before performing analysis. Much GIS data is available for the Tahoe Basin: elevation, orthophotography, soils, fire, wildlife, forestry… …evenland cover!
Data Collection • High-resolution historical land cover and impervious cover (IC) data is unavailable, so a comprehensive data collection effort is necessary to produce data for analysis in a GIS. • Case with many GIS projects: a need for specific data = time + $$$ Mapping historical land use change and increase in IC: • Derive land use data with IC estimates from historical orthophotography using traditional interpretation techniques (labor intensive!). • For present day coverage, derive land use and IC from IKONOS multispectral satellite imagery using remote sensing software employing semi-automated routines (T.Minor).
What is Remote Sensing? "...the science of acquiring, processing, and interpreting images, and related data, obtained from aircraft and satellites that record the interaction between matter and electromagnetic radiation." -- F.Sabins, 1997 OR MORE GENERALLY: Collecting information about an object without being in physical contact with it.
Satellite Imagery Reflected/scattered/emitted energy can be measured using various kinds of remote sensing instruments. Thankfully, many earth materials have very unique spectral signatures, almost like fingerprints.
Remote Sensing of Impervious Surfaces IKONOS high-resolution multispectral imagery • Collected by satellite that “scans” the earth rather than using a camera to photograph it. • 4 spectral bands: visible RED, GREEN, and BLUE plus NEAR INFRARED • 4-meter ground pixel resolution. • Current scene within pilot study area is approximately 25 km2. Acquiring entire basin coverage this summer.
Satellite Imagery vs. Aerial Photography 2000 IKONOS Imagery False natural color composite, bands 3-2-1 (RGB) 1987 Digital Orthophoto True natural color
Cover Variety in the Tahoe Basin Forest canopy cover and shadow is a major concern. Commercial area around the “Y” intersectionLow canopy cover Black Bart neighborhoodHigh-density canopy cover
Step 1 Mask out areas in the IKONOS scene known not to have any impervious cover using other data sources and visual inspection. Infrared false color composite, bands 4-2-1.
Step 2 Impervious cover layer generated using image classification processing techniques (PCA). Impervious cover in red, natural cover in black. However, forest canopy cover is still an issue…
Step 3 Looking through the trees: Use logical operations to fill gaps where forest canopy likely covers IC.
Road detected! Canopy covering road Road detected undercanopy shadow
Impervious Cover Natural Cover Row Total Impervious Cover (96) 92 4 96 Natural Cover (74) 8 66 74 Column Total 100 70 170 Accuracy Assessment In the field, 170 “random” points were surveyed using GPS. Labeled points as “impervious cover” or “natural cover”, then compared to corresponding points in IKONOS-derived IC layer. IC Layer Points Surveyed Points Overall Accuracy = 158/170 = 92.94%
What’s Next? • Derive IC for the entire pilot study area. • Compile historical land cover data using aerial photography. • Quantify change and analyze in a GIS. Contact:craumann@usgs.gov(650) 329-5648