Download

1 / 14
140 likes | 259 Vues
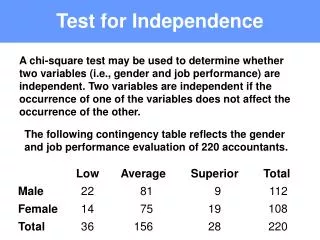
Test for Independence. =). Age Groups vs. # Voting in 2008 Presidential Election. # reporting that they voted (in millions). Test for Independence. A Test for Independence is used to assess whether or not paired observations (expressed in a contingency/two-way table), are independent.

E N D
Age Groups vs. # Voting in 2008 Presidential Election # reporting that they voted (in millions)
Test for Independence • A Test for Independence is used to assess whether or not paired observations (expressed in a contingency/two-way table), are independent. • For Example: Is voting in the 2008 Presidential Election independent of age?
You should always look at a graph of your data in order to get an idea of that the relationship might be. • For χ2 tests, you should convert the counts to %ages and create a bar chart.
Step #1: State the Hypotheses • Null Hypothesis (H0): data sets are independent • “Dull Hypothesis” – nothing is happening • Alternative Hypothesis (HA): data sets are not independent. • Something IS going on! • In this example: • Null Hypothesis (H0): Voting is independent of age • Alternative Hypothesis (HA):Voting is not independent of age.
Step #2: Calculate the Chi-Squared Statistic • Expected counts: • In order to perform the Test for Independence, we must know that all the expected counts are greater than 5.
χ2 = where = observed frequencies = expected frequencies • χ2 = ++ …. • χ2 =7.357
χ2 = where = observed frequencies = expected frequencies • χ2 = ++ …. • χ2 =7.017
Step #3: Calculate the Critical value. • The importance of our test statistic depends on two things: • (1) The significance level required (1%, 5%, 10%) • (2) The degrees of freedom of the data • DofF = (columns – 1)(rows– 1) = (2 – 1) (6 – 1) = (1) (5) = 5 degrees of freedom • Critical Value • The table you have in your information booklet allows to you determine the critical value… • Usually, the CV will be given to you on the EA.
Step #3 Continued .90 = 10% level of significance .95 = 5% level of significance .99 = 1% level of significance • Let’s use the 5% level of significance. • Critical Value for 5 degrees of freedom is: • 11.070
Step #4: Conclusion • If χ2 calcis less than the Critical Value do notreject the null hypothesis • If χ2 calcis more than the Critical Value rejectthe null hypothesis • In our example… • 7.017 < 11.070 • SO we do not reject the null hypothesis. • Present your conclusion IN CONTEXT. • Because our chi-squared statistic (7.375) is less than our critical value (11.070) we fail to reject the null hypothesis. There is not enough evidence that the decision to vote is dependent on age.
Example 2: • Volunteers are testing a new drug in a clinical trial. It is claimed that the new drug will result in a more rapid improvement rate for sick patients. • The company wants to test its claim at the 5% significance level.
Example 2: • H0: Drug administration and improvement are independent HA: Drug administration and improvement are dependent. • Expected Counts • χ2 = ++ χ2 =6.724 4) D.f. = (2-1)(2-1) = (1)(1) = 1 5) Critical Value: 3.841 * 6.724 > 3.841 6) Because our calculated value of χ2 (6.724) is greater than our critical value (3.841), we can reject the null hypothesis. This suggests that drug administration and improvement are dependent. It appears that the drug does aid in patents’ improvement.
Next Class • We will spend more time on chi-squared tests of independence. • We will learn how to do them on our GDC! • Using p-values