Download
1 / 1
10 likes | 121 Vues
Samples & materials. ∞. Dielectric Spectroscopy of Genomic DNA Solutions.

E N D
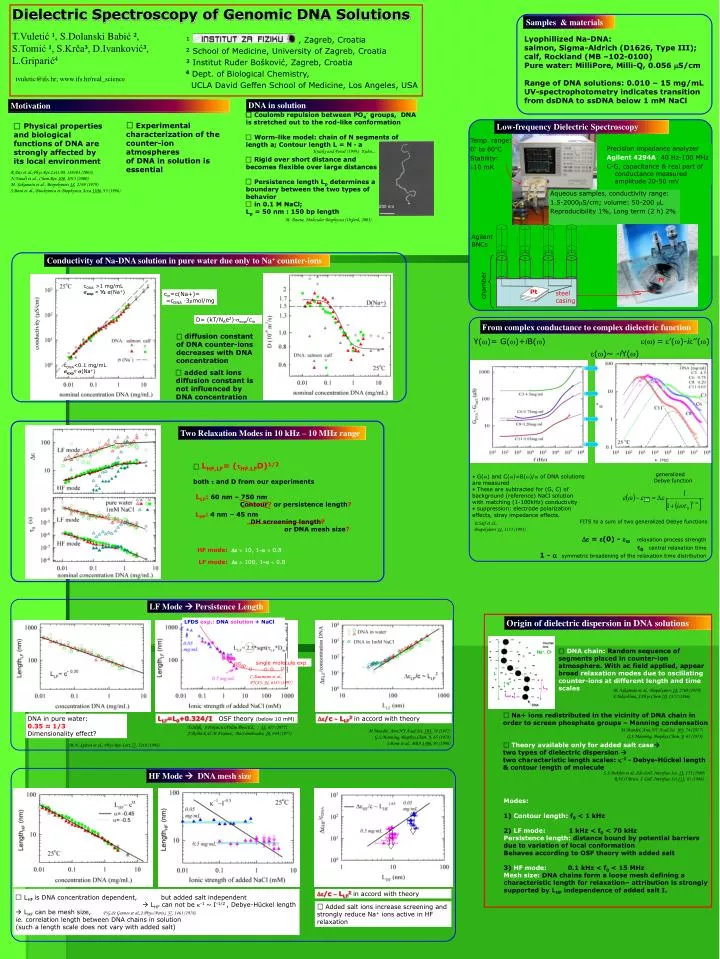
Samples & materials ∞ Dielectric Spectroscopy ofGenomic DNA Solutions Lyophillized Na-DNA: salmon, Sigma-Aldrich (D1626, Type III); calf, Rockland (MB –102-0100)Pure water: MilliPore, Milli-Q, 0.056 mS/cmRange of DNA solutions: 0.010 – 15 mg/mLUV-spectrophotometry indicates transition from dsDNA to ssDNA below 1 mM NaCl • T.Vuletić ¹, S.Dolanski Babić², S.Tomić ¹, S.Krča³, D.Ivanković³, L.Griparić4 • tvuletic@ifs.hr; www.ifs.hr/real_science ¹ , Zagreb, Croatia ² School of Medicine, University of Zagreb, Croatia ³ Institut Ruđer Bošković, Zagreb, Croatia 4 Dept. of Biological Chemistry, UCLA David Geffen School of Medicine, Los Angeles, USA Motivation DNA in solution Coulomb repulsion between PO4- groups, DNA is stretched outto the rod-likeconformation Worm-like model: chain of N segments of length a;Contour length L = N · a Rigid over short distance and becomes flexibleover largedistances Persistence length Lp determines a boundarybetween the two types of behavior in 0.1 M NaCl; Lp= 50 nm : 150 bp length Experimental characterization of the counter-ion atmospheres of DNA in solution is essential Physical properties and biological functions of DNAare strongly affected by its local environment Low-frequency Dielectric Spectroscopy Temp. range: 0° to 60°C Stability: ±10 mK Precision impedance analyzer Agilent 4294A: 40 Hz-100 MHz C-G, capacitance & real part of conductance measured amplitude 20-50 mV Kratky and Porod (1949); Kuhn... R.Das et al.,Phys.Rev.Lett.90, 188103 (2003) N.Nandi et al., Chem.Rev.100, 2013 (2000) M. Sakamoto et al., Biopolymers 18, 2769 (1979) S.Bone et al., Biochymica et Biophysica Acta 1306, 93 (1996) Aqueous samples, conductivity range: 1.5-2000mS/cm; volume: 50-200 mL Reproducibility 1%, Long term (2 h) 2% 200 nm M. Daune, Molecular Biophysics (Oxford, 2003) Agilent BNCs Conductivity of Na-DNA solution in pure water due only to Na+counter-ions Pt cDNA >1 mg/mL sexp≈ ½ s(Na+) cin=c(Na+)= =cDNA·3mol/mg D= (kT/NAe2)·sexp/cin diffusion constant of DNA counter-ions decreases with DNA concentration cDNA<0.1 mg/mL sexp≈s(Na+) added salt ions diffusion constant is not influenced by DNA concentration chamber Pt steel casing Two Relaxation Modes in 10 kHz – 10 MHz range From complex conductance to complex dielectric function e(w) = e’(w)-ie’’(w) Y(w)= G(w)+iB(w) e(w)~ -iY(w) LHF,LF= (tHF.LFD)1/2bothtand D from our experiments LLF:60 nm – 750 nm Contour? or persistence length? LHF: 4 nm – 45 nm DH screening length? or DNA mesh size? HF mode:De 10, 1-a 0.8 LF mode:De 100, 1-a 0.8 generalized Debye function • G(w) and C(w)=B(w)/w of DNA solutions are measured • These are subtracted for (G, C) of background (reference) NaCl solution with matching (1-100kHz) conductivity • suppression: electrode polarization effects, stray impedance effects. Origin of dielectric dispersion in DNA solutions FITS to a sum of two generalized Debye functions B.Saif et al., Biopolymers 31, 1171 (1991) DNA chain:Random sequence of segments placed incounter-ion atmosphere. With ac field applied, appear broad relaxation modes due to oscillating counter-ions at different length and time scales = (0) - ∞relaxation process strength 0 central relaxation time 1 - symmetric broadening of the relaxation time distribution M. Sakamoto et al., Biopolymers 18, 2769 (1979) S.Takashima, J.Phys.Chem.70, 1372 (1966) Na+ ions redistributed in the vicinity of DNA chain in order to screenphosphate groups – Manning condensation Theory available only for added salt case two types of dielectric dispersion two characteristic length scales: k-1- Debye-Hückel length & contour length of molecule De/c ~ LLF2 in accord with theory M.Mandel, Ann.NY Acad.Sci. 303, 74 (1977) G.S.Manning, Biophys.Chem. 9, 65 (1978) M.Mandel, Ann.NY Acad.Sci. 303, 74 (1977) G.S.Manning, Biophys.Chem. 9, 65 (1978) S.Bone et al., BBA 1306, 93 (1996) S.S.Dukhin et al, Adv.Coll. Interface Sci. 13, 153 (1980) R.W.O’Brien, J. Coll. Interface Sci 113, 81 (1986). HF Mode DNA mesh size Modes: 1) Contour length: f0 < 1 kHz 2)LF mode:1 kHz < f0 < 70 kHz Persistence length:distance bound by potential barriers due to variation of local conformation Behaves according to OSF theory with added salt 3)HF mode:0.1 kHz < f0 < 15 MHzMesh size: DNA chains form a loose mesh defining a characteristic length for relaxation– attribution is strongly supported by LHF independence of added salt I. - Na+, Cl- - - - - - L - k-1 - Lp - LHF LHF is DNA concentration dependent, but added salt independent LHFcan not be k-1 ~ I-1/2 , Debye-Hückel length LHFcan be mesh size, ie. correlation length between DNA chains in solution (such a length scale does not vary with added salt) De/c ~ LLF2 in accord with theory Added salt ions increase screening and strongly reduce Na+ ions active in HF relaxation P.G.de Gennes et al.,J.Phys.(Paris), 37, 1461 (1976) LF Mode Persistence Length LFDS exp.: DNA solution + NaCl single molecule exp. C.Baumann et al., PNAS, 94, 6185 (1997) DNA in pure water: 0.35 ≈ 1/3 Dimensionality effect? LLF=L0+0.324/I OSF theory (below 10 mM) T.Odijk, J.Polym.Sci.Polim.Phys.Ed., 15, 477 (1977) J.Skolnick & M.Fixman,, Macromolecules, 10, 944 (1977) M.N. Spiteri et al., Phys.Rev.Lett.77, 5218 (1996)