Download
1 / 1
10 likes | 132 Vues
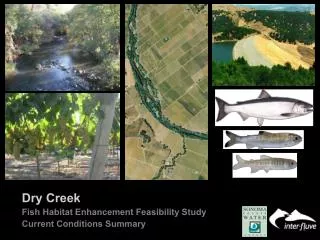
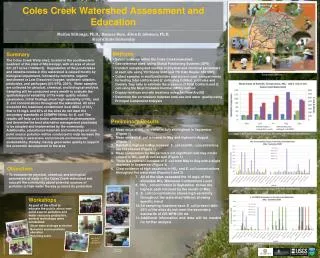
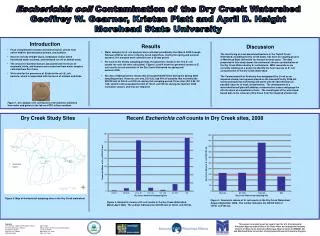
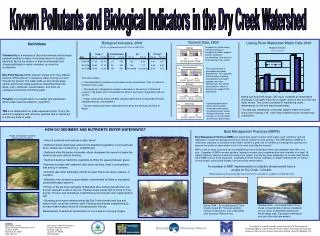
Habitat Assessment in Dry Creek Watershed. Summary of Averaged Habitat Assessment Scores Per Location. Habitat Assessment Method

E N D
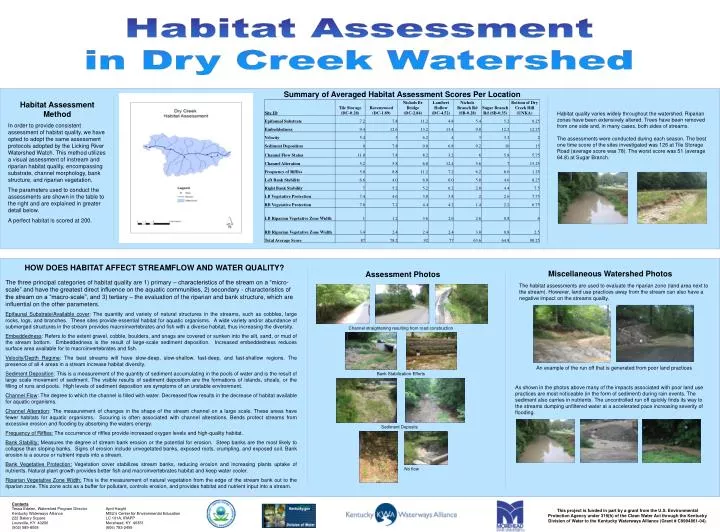
Habitat Assessment in Dry Creek Watershed Summary of Averaged Habitat Assessment Scores Per Location Habitat Assessment Method In order to provide consistent assessment of habitat quality, we have opted to adopt the same assessment protocols adopted by the Licking River Watershed Watch. This method utilizes a visual assessment of instream and riparian habitat quality, encompassing substrate, channel morphology, bank structure, and riparian vegetation. The parameters used to conduct the assessments are shown in the table to the right and are explained in greater detail below. A perfect habitat is scored at 200. Habitat quality varies widely throughout the watershed. Riparian zones have been extensively altered. Trees have been removed from one side and, in many cases, both sides of streams. The assessments were conducted during each season. The best one time score of the sites investigated was 126 at Tile Storage Road (average score was 78). The worst score was 51 (average 64.8) at Sugar Branch. HOW DOES HABITAT AFFECT STREAMFLOW AND WATER QUALITY? Miscellaneous Watershed Photos Assessment Photos The three principal categories of habitat quality are 1) primary – characteristics of the stream on a “micro-scale” and have the greatest direct influence on the aquatic communities, 2) secondary - characteristics of the stream on a “macro-scale”, and 3) tertiary – the evaluation of the riparian and bank structure, which are influential on the other parameters. Epifaunal Substrate/Available cover: The quantity and variety of natural structures in the streams, such as cobbles, large rocks, logs, and branches. These sites provide essential habitat for aquatic organisms. A wide variety and/or abundance of submerged structures in the stream provides macroinvertebrates and fish with a diverse habitat, thus increasing the diversity. Embeddedness: Refers to the extent gravel, cobble, boulders, and snags are covered or sunken into the silt, sand, or mud of the stream bottom. Embeddedness is the result of large-scale sediment deposition. Increased embeddedness reduces surface area available for to macroinvertebrates and fish. Velocity/Depth Regime: The best streams will have slow-deep, slow-shallow, fast-deep, and fast-shallow regions. The presence of all 4 areas in a stream increase habitat diversity. Sediment Deposition: This is a measurement of the quantity of sediment accumulating in the pools of water and is the result of large scale movement of sediment. The visible results of sediment deposition are the formations of islands, shoals, or the filling of runs and pools. High levels of sediment deposition are symptoms of an unstable environment. Channel Flow: The degree to which the channel is filled with water. Decreased flow results in the decrease of habitat available for aquatic organisms. Channel Alteration: The measurement of changes in the shape of the stream channel on a large scale. These areas have fewer habitats for aquatic organisms. Scouring is often associated with channel alterations. Bends protect streams from excessive erosion and flooding by absorbing the waters energy. Frequency of Riffles: The occurrence of riffles provide increased oxygen levels and high-quality habitat. Bank Stability: Measures the degree of stream bank erosion or the potential for erosion. Steep banks are the most likely to collapse than sloping banks. Signs of erosion include unvegetated banks, exposed roots, crumpling, and exposed soil. Bank erosion is a source or nutrient inputs into a stream. Bank Vegetative Protection: Vegetation cover stabilizes stream banks, reducing erosion and increasing plants uptake of nutrients. Natural plant growth provides better fish and macroinvertebrates habitat and keep water cooler. Riparian Vegetative Zone Width: This is the measurement of natural vegetation from the edge of the stream bank out to the riparian zone. This zone acts as a buffer for pollutant, controls erosion, and provides habitat and nutrient input into a stream. The habitat assessments are used to evaluate the riparian zone (land area next to the stream). However, land use practices away from the stream can also have a negative impact on the streams quality. Channel straightening resulting from road construction An example of the run off that is generated from poor land practices Bank Stabilization Efforts As shown in the photos above many of the impacts associated with poor land use practices are most noticeable (in the form of sediment) during rain events. The sediment also carries in nutrients. The uncontrolled run off quickly finds its way to the streams dumping unfiltered water at a accelerated pace increasing severity of flooding. Sediment Deposits No flow Contacts Tessa Edelen, Watershed Program Director April Haight Kentucky Waterways Alliance MSU’s Center for Environmental Education 222 Bakery Square LC 101A, IRAPP Louisville, KY 40206 Morehead, KY 40351 (502) 589-8008 (606) 783-2455 This project is funded in part by a grant from the U.S. EnvironmentalProtection Agency under 319(h) of the Clean Water Act through the KentuckyDivision of Water to the Kentucky Waterways Alliance (Grant # C9994861-04).