Download
1 / 23
230 likes | 360 Vues
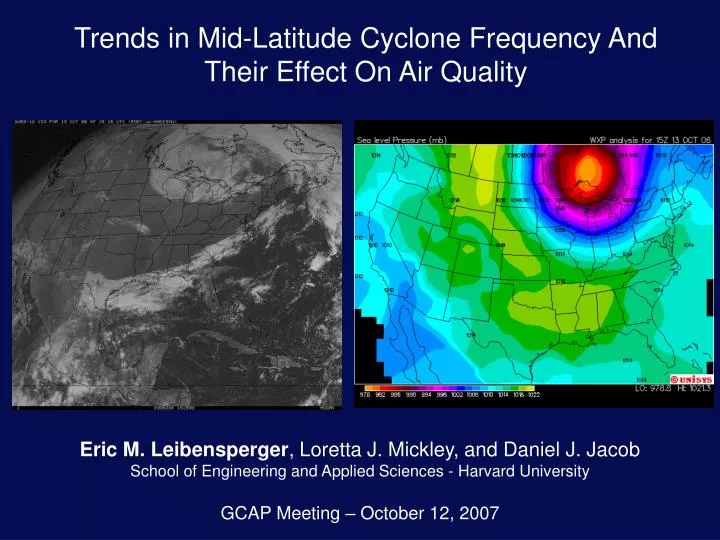
Trends in Mid-Latitude Cyclone Frequency And Their Effect On Air Quality. Eric M. Leibensperger , Loretta J. Mickley, and Daniel J. Jacob School of Engineering and Applied Sciences - Harvard University GCAP Meeting – October 12, 2007. 1999-2001. 2049-2051.

E N D
Trends in Mid-Latitude Cyclone Frequency And Their Effect On Air Quality Eric M. Leibensperger, Loretta J. Mickley, and Daniel J. Jacob School of Engineering and Applied Sciences - Harvard University GCAP Meeting – October 12, 2007
1999-2001 2049-2051 A Decrease in Mid-Latitude Cyclones: 2000-2050 [Wu et al., in press] 1999-2001 vs. 2049-2051: 17% decrease 1999-2005 vs. 2049-2055: 16% decrease
High-latitudes [McCabe, et al., 2001] Mid-latitudes Past and Future Trends of Mid-Latitude Cyclones Previous studies have found a decrease in the frequency of observed cyclones and cyclones objectively tracked from reanalysis data. Additional studies have identified a decrease in cyclones in future climate simulations. [Lambert, et al., 2006]
720 km 990 mb 1000 mb Storm Tracking 4x daily SLP fields (NCEP/NCAR or ECMWF Reanalysis, GISS GCM 3 4x5 and 2x2.5) used with the GISS Storm Tracker [Bauer and Del Genio, 2007] [Zishka and Smith, 1981]
1950-2005 Summer Cyclone Frequencies NCEP/NCAR Reanalysis GISS GCM 3– 2x2.5 – Specified SST (data courtesy of Jean Lerner) GISS GCM 3– 4x5 – Q-Flux Ocean 1980-2005 trend is comparable between GISS GCM 4x5 and Reanalysis [Leibensperger et al., in prep.]
Relationship between Ozone and Mid-latitude Cyclones – 1980-1998 Correlation coefficient between # of cyclones and # of O3 exceedances The frequency of cyclones tracking through the southern track is strongly anti-correlated with the number of ozone exceedances [Leibensperger et al., in prep.]
Cyclone Frequency and Ozone in the Northeast r=-0.29 r=-0.64 Removing linear trends in cyclone frequency and exceedances enhances the anti-correlation [Leibensperger et al., in prep.]
19 – 5 = 14 days days yr-1 days yr-1 days yr-1 [Leibensperger et al., in prep.] The Air Quality Penalty Due to Decreasing Cyclone Frequency Without the decrease in the number of cyclones, the number of exceedances would have been lowered to 5 rather than 19 days. Future decreases in cyclone frequency will make air quality goals more difficult to achieve.
[Mickley et al., 2004] Future Work • Extend analysis from 1998 to 2006, publish results • Use tracer within GCM to diagnose changes in transport • Effects of climate change on air pollution meteorology • - Transport (cyclones, convection) • - Lightning COt = Carbon Monoxide Tracer CPD of CO tracer at the surface during low cyclone years versus high cyclone years is similar to Loretta’s findings for 2050
Northeast at surface Southeast at surface Midwest at surface
Northeast at 400hPa Southeast at 400hPa Midwest at 400hPa Less tracer makes it this high
Less outflow from N.A. – but more to the north, could be from increased frequency there
Most tracer sourced where lower track most effective – net effect is less in upper trop.
Time Series of Cyclones – NCEP/NCAR Reanalysis 1 Hurricane Cleo Tropical Storm Brenda
1. Can the GCM and reanalysis data reproduce expected cyclone statistics? [Whittaker and Horn, 1984] (cyclones/20 years) GISS 4x5 and NCEP main storm tracks are comparable to the observed main track frequencies in position. NCEP storm tracks well represented quantitatively, but GISS 4x5 is too low. 60 40 20
Cyclones in the GISS GCM III at 2ºx2.5º [Whittaker and Horn, 1984] (cyclones/20 years) The frequency of cyclones in the GISS GCM 2x2.5 is improved, but the tracks appear shifted to the southeast. 60 40 20
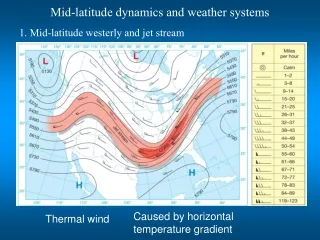
Mean 4-10 Day Integrated Power of FFT of Max 8-hr Avg Time Series Why mid-latitude cyclones? Cold Warm Lighter winds In the northeastern United States, many variables affecting ozone production (temperature, cloud cover, stagnation) and transport change on a synoptic timescale thus making mid-latitude cyclones a major driver of surface ozone concentrations